Follow the sequence
Regional heavy rain begins
WMO identifies 17–21 July as the principal extreme-rain period in Henan. China’s annual climate bulletin uses a longer 17–24 July window for the wider provincial episode.
An exceptional hour
Zhengzhou recorded 201.9 mm in one hour on 20 July, according to WMO’s climate-event account. The same account gives 382 mm for a six-hour period.
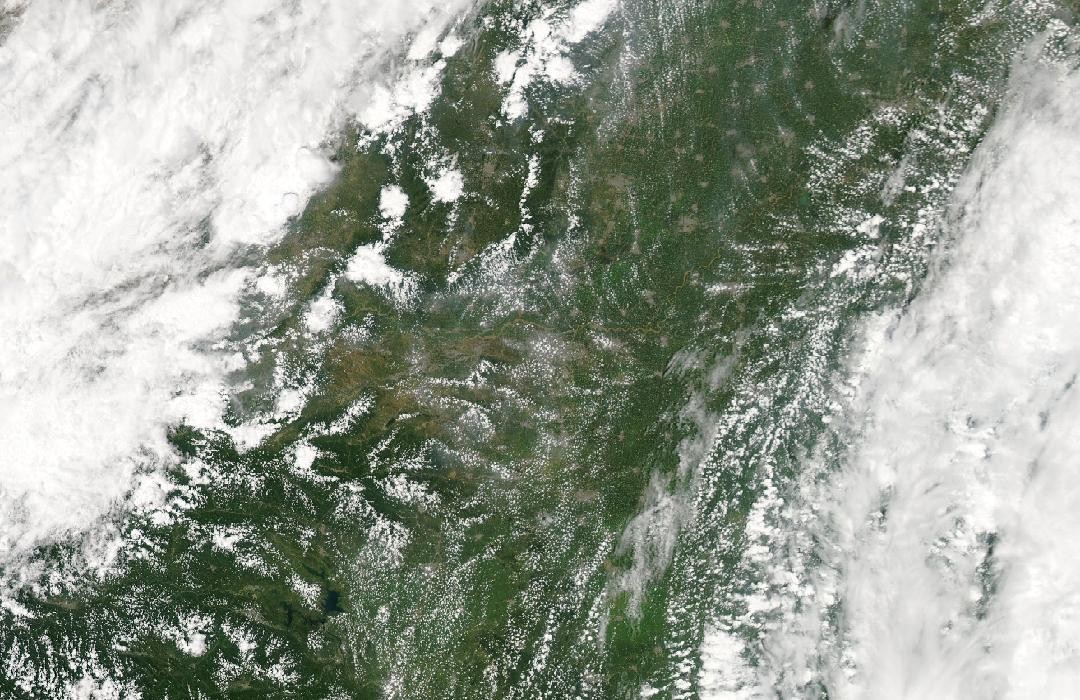
Floodwater remains visible
Aqua MODIS acquired a false-color view of northern Henan showing continued flooding. NASA compares it with July 2020; this regional aftermath view is not a photograph of the peak hour in Zhengzhou.
Basis: World Meteorological Organization [1] · China Meteorological Administration [2] · NASA Earth Observatory [3]
Selected observations & analyses
These entries preserve the source’s reported quantities or analyses. They are not a newly processed observational dataset.
| Evidence | Reported value or finding | Provenance |
|---|---|---|
| Hourly rainfall at Zhengzhou | 201.9 mm in one hour | 20 July 2021 station observation reported by WMO and confirmed as a mainland China hourly record in the China Meteorological Administration annual bulletin. |
| Longer accumulation | 382 mm in six hours | WMO’s 31 October 2021 account of the Zhengzhou event; an accumulation over six hours, not six repetitions of the maximum hourly rate. |
The atmospheric mechanism
For drainage, the rate at which water arrives is as important as the final total. When rainfall exceeds the rate at which soil can absorb it or drains can carry it away, water begins accumulating and moving over the surface. An unusually intense hour can therefore produce a rapid response even within an already wet multi-day event. Dividing a daily total by twenty-four would smooth away the very burst that most strongly challenged local drainage.
The regional storm was slow moving, as NASA’s account emphasizes, allowing repeated precipitation across connected catchments. Those catchments do not respond simultaneously. Small urban channels can rise quickly, while larger rivers and reservoirs retain and route water for longer. The 26 July satellite view captures part of that later hydrological state. It cannot reveal the minute-by-minute rain history that produced it. Comparing the gauge record with a later surface-water map is useful precisely because they answer different questions about timing and spatial extent.
Basis: World Meteorological Organization [1] · China Meteorological Administration [2] · NASA Earth Observatory [3]
What the evidence does not establish
The hourly extreme is a point record rather than a province-wide rain rate. The cited agencies use different dates for their summaries of the wider event, so a total should retain the window from its own source. NASA’s northern Henan image does not measure flood depth in Zhengzhou, and the later arrival of Typhoon In-fa on China’s coast should not be confused with a direct typhoon landfall at Zhengzhou during the 20 July burst.
Keep the maximum hour, multi-day rainfall and later flood extent separate; comparing their clocks explains why a single headline total is incomplete.
Sources & provenance
- State of Climate in 2021: Extreme events and major impacts World Meteorological Organization · 2021-10-31Reference only; original paraphrase; no source media reproduced.
- China Climate Bulletin 2021 China Meteorological Administration · 2021 annual bulletin; publication date not verifiedReference only; original paraphrase; no source media reproduced.
- Flooding in Central China NASA Earth Observatory · 2021-07-28Reference only; original paraphrase; no source media reproduced.
Explanations and diagrams are original educational interpretations. Source institutions have not endorsed or reviewed this publication. How we distinguish evidence from models.