Follow the sequence
A new heavy-rain period
NASA’s event summary identifies 8 August as the start of the major episode, with unusually high rainfall continuing through 16 August.
The satellite accumulation window ends
The published IMERG product covers 19 July–18 August. It includes both earlier monsoon rain and the August event, so its mapped totals are not an August-only accumulation.
A season-to-date comparison
The rainfall summary cited by NASA reports 164 percent more rain than normal during the first twenty days of August, a regional anomaly rather than an individual gauge total.
Water visible after the rain
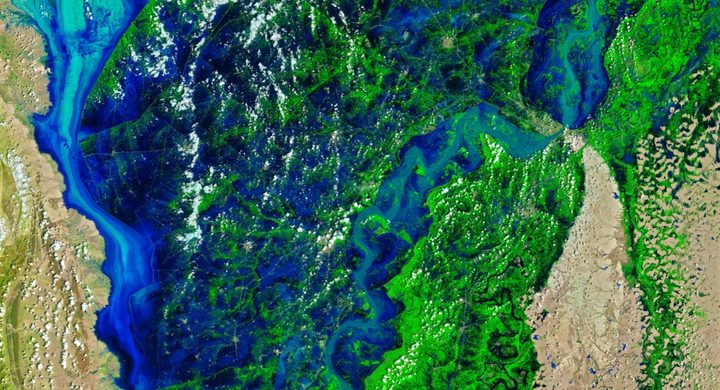
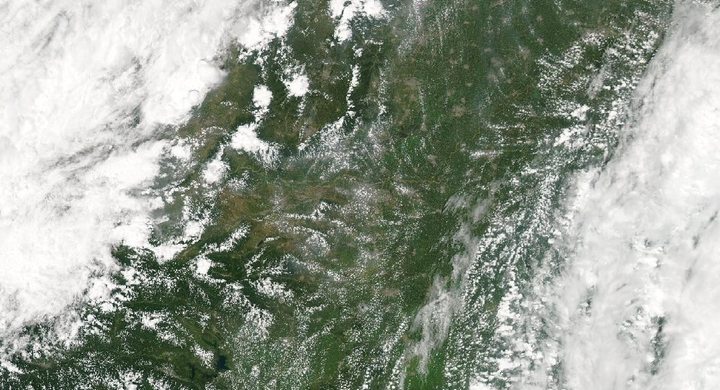
Sentinel-2 observed inundated land and swollen rivers. NASA’s comparison uses a Landsat 8 image from February, with different false-color band combinations appropriate to each sensor.
Basis: NASA Earth Observatory [1] · NASA Earth Observatory [2]
Selected observations & analyses
These entries preserve the source’s reported quantities or analyses. They are not a newly processed observational dataset.
| Evidence | Reported value or finding | Provenance |
|---|---|---|
| August regional anomaly | 164% more rain than normal during 1–20 August | Rainfall assessment relayed by NASA Earth Observatory from the India Meteorological Department context; a relative regional amount, not 164 mm. |
| Post-event surface observation | Sentinel-2, 22 August 2018 | NASA’s before-and-after account uses bands 11–8–3 to emphasize water; the February comparison is Landsat 8 bands 6–5–3. |
The atmospheric mechanism
A monsoon supplies a large-scale flow of moist air, but flood production depends on how that supply varies through time and where the air rises. Along southwestern India, the coast and elevated inland terrain provide a setting where moisture transport and ascent can reinforce one another. Repeated episodes matter because the next burst arrives on a landscape already altered by the previous rain, rather than on a freshly dry surface.
For interpretation, imagine the catchment as several connected stores: soil, small channels, rivers, wetlands and reservoirs. Each has a capacity and a release time. Sustained rain can fill several stores together, allowing runoff to propagate downstream while more rain arrives upstream. That conceptual model helps explain the persistence of flooding, but it is not a reconstruction of Kerala’s reservoir operations. NASA explicitly revised its account to avoid attributing the flood to releases without the additional evidence required for such a conclusion.
Basis: NASA Earth Observatory [1] · NASA Earth Observatory [2]
What the evidence does not establish
A percentage anomaly requires its baseline and time window; it must not be compared directly with a storm total in millimeters. IMERG maps are remotely sensed estimates that can miss local maxima. The two optical scenes were acquired in different seasons by different sensors, so not every visual difference is flood damage. Neither product establishes the timing or impact of a specific dam operation.
Read the new rain in the context of earlier wetness, then separate observed water extent from any proposed explanation involving storage or releases.
Sources & provenance
- A Flood for the Century in India NASA Earth Observatory · 2018-08-22; explanatory correction 2018-08-28Reference only; original paraphrase; no source media reproduced.
- Before and After the Kerala Floods NASA Earth Observatory · 2018-08-25Reference only; original paraphrase; no source media reproduced.
Explanations and diagrams are original educational interpretations. Source institutions have not endorsed or reviewed this publication. How we distinguish evidence from models.