Follow the sequence
A wet starting point
The Bureau of Meteorology identifies an already wet landscape before the main episode, with limited remaining capacity to absorb rainfall.
The trough deepens
A coastal trough strengthened and remained near the coast beneath the influence of a blocking high near New Zealand.
The focus shifts south
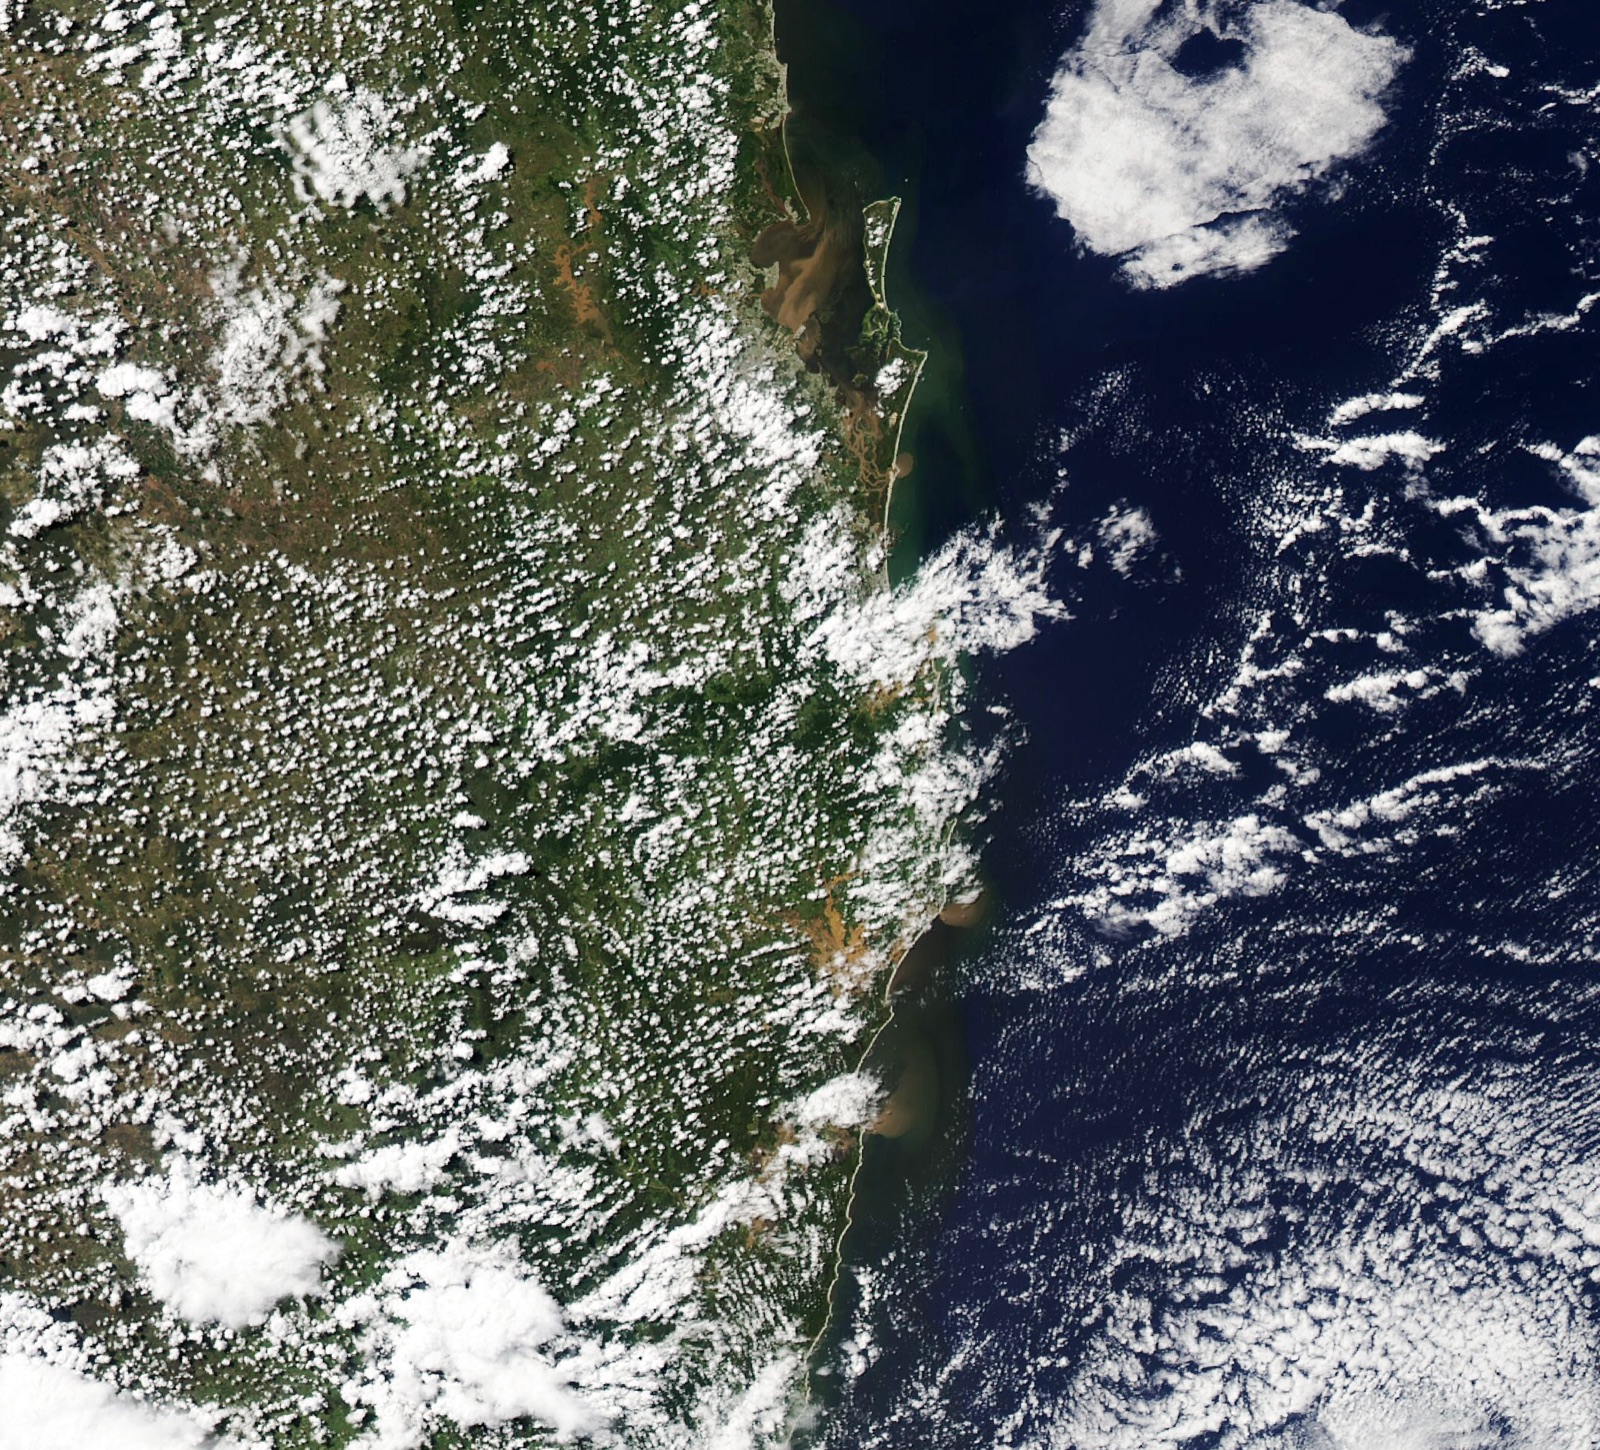
After repeated rain in south-east Queensland and north-east New South Wales, subsequent low-pressure development drew the main rain focus farther south.
A prolonged regional episode
Further east-coast lows in early March extended heavy rain into the Hawkesbury–Nepean region; the case window ends on 9 March, not when all flooding ended.
Basis: Australian Bureau of Meteorology [1] · Australian Bureau of Meteorology [2]
Selected observations & analyses
These entries preserve the source’s reported quantities or analyses. They are not a newly processed observational dataset.
| Evidence | Reported value or finding | Provenance |
|---|---|---|
| Brisbane City six-day rainfall | 792.9 mm, 23–28 February | BOM Special Climate Statement 76; Brisbane City gauge, dates as reported. |
| Spatial extent of exceptional rain | More than 50 sites exceeded 1,000 mm in a week | BOM statement; south-east Queensland and north-east NSW, week ending 1 March. |
| Evidence type | Gauge totals and post-event synoptic analysis | BOM statement published 25 May 2022; not a live forecast. |
The atmospheric mechanism
The Bureau describes a blocking high near New Zealand, a coastal trough and successive lows drawing moist air from the Coral and Tasman seas. The large-scale arrangement kept favorable rain-producing conditions in place. Embedded thunderstorms supplied local bursts within a much longer wet period. A broad rain shield and a small intense cell can therefore be part of the same event.
Use two ledgers when reading a flood-producing episode: atmospheric input and catchment response. A gauge measures water arriving at one point. A river integrates water over a catchment and over time. Antecedent wetness changes how much additional rain becomes runoff. The controlled moisture lab isolates a thermodynamic relationship; it cannot reproduce the regional circulation or calculate these river levels.
Basis: Australian Bureau of Meteorology [1] · Australian Bureau of Meteorology [2]
What the evidence does not establish
The six-day Brisbane amount must not be labelled a daily total or transferred to every suburb. The Bureau’s statement reports different outcomes in different river systems; there is no single universal ranking of this event against 2011. La Niña describes background climate conditions, not a complete explanation of the placement and intensity of an individual rainband.
An event can move south while a northern river continues rising. Keep the rainfall clock and the river-response clock separate, then compare their actual observation windows.
Sources & provenance
- Special Climate Statement 76: Extreme rainfall and flooding in south-eastern Queensland and eastern New South Wales Australian Bureau of Meteorology · 2022-05-25Reference only; original paraphrase; no source media reproduced.
- Annual Climate Statement 2022 Australian Bureau of Meteorology · 2023Reference only; original paraphrase; no source media reproduced.
Explanations and diagrams are original educational interpretations. Source institutions have not endorsed or reviewed this publication. How we distinguish evidence from models.