Follow the sequence
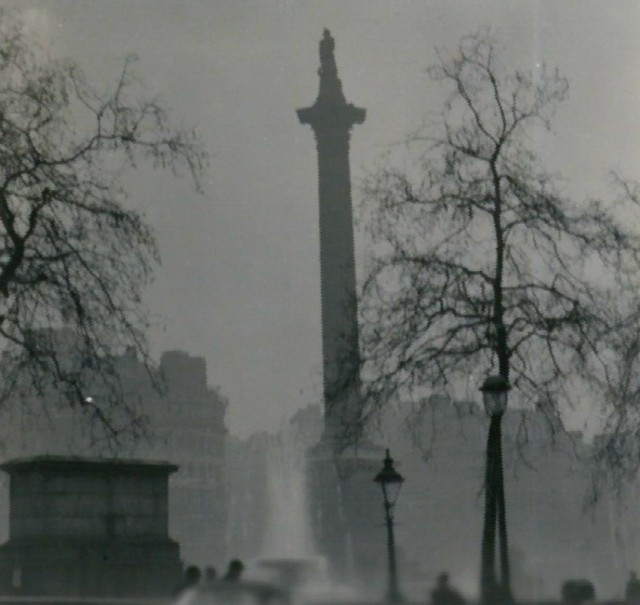
Fog develops under clear, calm conditions
The Met Office describes moist near-ground air cooling under clear skies and light winds. Fog thickened after nightfall.
Daytime clearance fails
Low winter sunshine did not disperse the dense layer. Further nighttime cooling and continuing pollution sustained the episode over subsequent days.
The fog clears
The Met Office dates the clearing to 9 December. The meteorological episode ended, while its human consequences extended beyond that day.
Basis: Met Office [1] · National Centre for Atmospheric Science [2]
Selected observations & analyses
These entries preserve the source’s reported quantities or analyses. They are not a newly processed observational dataset.
| Evidence | Reported value or finding | Provenance |
|---|---|---|
| Event duration | 5–9 December 1952 | Met Office historical case study. |
| Fog depth in the reconstruction | Approximately 100–200 m | Met Office explanatory account; regional approximation, not a complete three-dimensional survey. |
| Near-surface setting | Moist air, light winds and an inversion | Met Office meteorological reconstruction; pollution emissions were an additional essential component. |
The atmospheric mechanism
With clear skies, the ground loses longwave radiation and can cool the air immediately above it. As air approaches saturation, droplets may form on suitable particles. An inversion means temperature increases with height through a layer; it resists the vertical mixing that would otherwise help disperse near-surface material. Weak horizontal winds also limit ventilation.
Fog droplets and pollutant particles are related but different components. The episode was not simply a harmless natural fog made visually dramatic. Combustion emissions and atmospheric chemistry were integral to the smog. In the moisture lab, cooling a parcel toward its dew point explains the saturation step only. It does not calculate pollution concentration, chemical transformation or the distribution of exposure across a city.
Basis: Met Office [1] · National Centre for Atmospheric Science [2]
What the evidence does not establish
The cited depth is a simplified historical description. This case does not invent a radiosonde profile or assign a uniform fog thickness to all London streets. Visibility cannot be translated directly into a pollutant dose, and the color of present-day haze cannot by itself establish the same chemistry as 1952. Historical health estimates require their own methods and are not inferred from this schematic.
When a murky layer persists, ask two separate questions: what produced the droplets or particles, and what prevented ventilation? A temperature inversion helps answer the second, but does not identify every material trapped below it.
Sources & provenance
- The Great Smog of 1952 Met Office · Publication date not statedReference only; original paraphrase; no source media reproduced.
- Great Smog 70 years on: new laws to clean London’s air National Centre for Atmospheric Science · 2022-12-06Reference only; original paraphrase; no source media reproduced.
Explanations and diagrams are original educational interpretations. Source institutions have not endorsed or reviewed this publication. How we distinguish evidence from models.