Follow the sequence
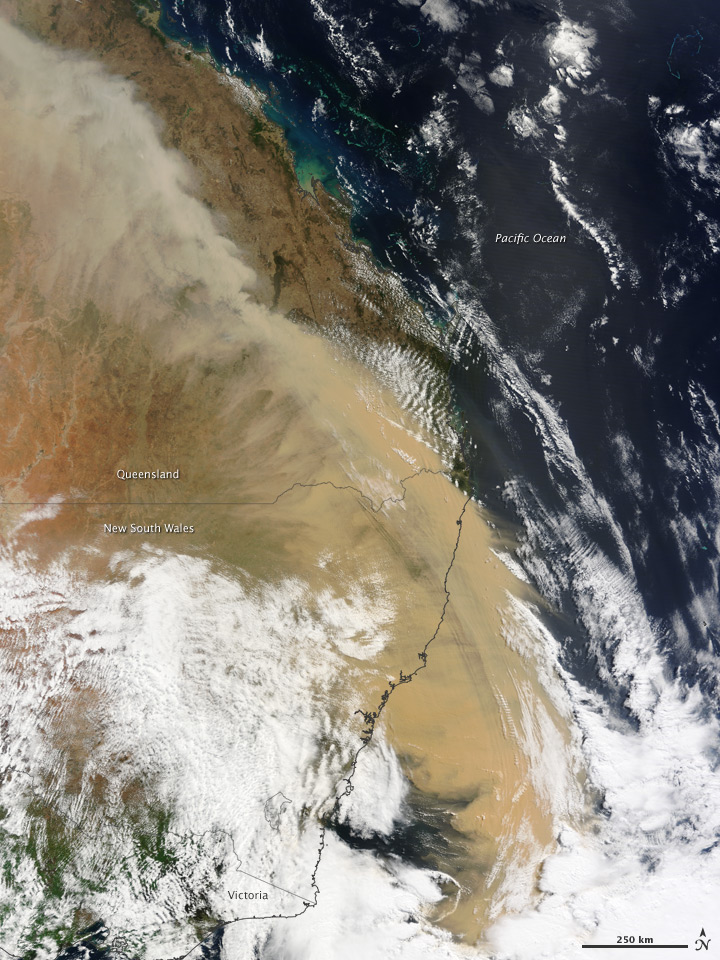
Dust crosses inland New South Wales
The Bureau’s monthly review identifies a widespread dust event on 22–23 September, carried eastward by strong winds from dry inland source regions.
A red morning on the coast
Dust reached Sydney by morning and produced severely reduced visibility. Air-quality instruments and weather observations recorded different aspects of the plume.
The regional footprint extends north
The Bureau’s annual summary describes dust extending into central and northern Queensland by evening. The plume was much larger than a single city view.
Basis: Australian Bureau of Meteorology [1] · Alan G. Wain, John L. McBride and Graham A. Mills, CAWCR [2] · Australian Bureau of Meteorology [3]
Selected observations & analyses
These entries preserve the source’s reported quantities or analyses. They are not a newly processed observational dataset.
| Evidence | Reported value or finding | Provenance |
|---|---|---|
| Sydney visibility | Approximately 300 m in the official monthly account | BOM September 2009 NSW review, also reproduced in the NSW air-quality monitoring report. |
| Reported source region | Lake Eyre region and western New South Wales | BOM event interpretation; not a claim that every particle had one exact origin. |
| Transport evidence | Strong westerly winds and a continental-scale plume | BOM review and CAWCR transport-model study. |
The atmospheric mechanism
Strong winds can lift loose material when surface conditions permit, then transport finer particles far from the source. The dust remains an aerosol rather than becoming a cloud of water droplets. Its effect on visible light changes the apparent sky color and reduces contrast, but color alone is not a chemical fingerprint. The low-angle morning illumination also affects how the scene appears.
A weather map helps distinguish local production from transport. If the air arriving in Sydney has passed across dry inland regions, an upwind source becomes plausible; satellite imagery and trajectory calculations add evidence. The cited CAWCR work used atmospheric transport modeling to investigate the episode. A modeled trajectory is an inference constrained by winds, not a tag attached to each observed dust grain.
Basis: Australian Bureau of Meteorology [1] · Alan G. Wain, John L. McBride and Graham A. Mills, CAWCR [2] · Australian Bureau of Meteorology [3]
What the evidence does not establish
A visibility observation is not the same variable as particulate mass concentration. Converting one to the other requires particle-size and optical assumptions. The reported source region is broad, and the red appearance cannot diagnose a precise mineral mixture. This page uses no reconstructed “photograph” and makes no claim about the health effect of a particular viewer’s exposure.
When the sky changes color, ask what is suspended in the air and where the air came from. Pair the visible clue with wind, visibility and aerosol evidence before assigning a cause.
Sources & provenance
- Monthly Weather Review: New South Wales, September 2009 Australian Bureau of Meteorology · 2009-09 reportReference only; original paraphrase; no source media reproduced.
- HYSPLIT and ACCESS simulations of the September 2009 East Australian continental scale dust storm Alan G. Wain, John L. McBride and Graham A. Mills, CAWCR · 2009 workshop reportReference only; original paraphrase; no source media reproduced.
- Annual Climate Summary 2009 Australian Bureau of Meteorology · 2010Reference only; original paraphrase; no source media reproduced.
Explanations and diagrams are original educational interpretations. Source institutions have not endorsed or reviewed this publication. How we distinguish evidence from models.