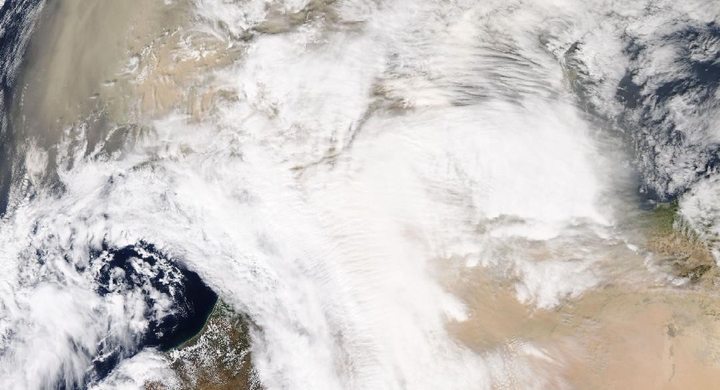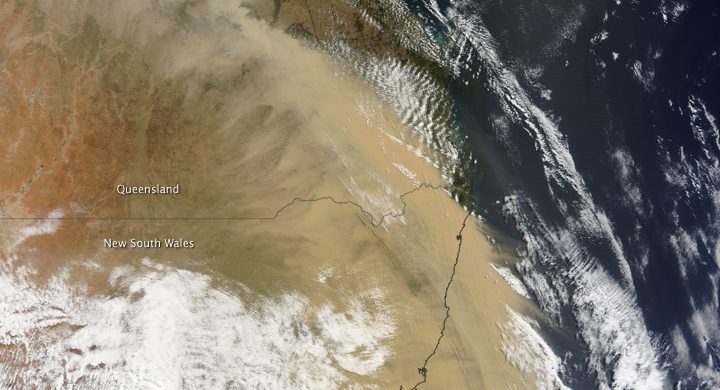
Follow the sequence
A month of dust pulses begins
NASA’s displayed model sequence covers 2–27 June. It represents modeled transport through the month rather than a sequence of ordinary photographs.
A large Atlantic aerosol signal
NASA described a preliminary MODIS analysis showing an exceptionally large Atlantic aerosol optical-depth signal. Optical depth measures light attenuation through a column.
Lidar adds the vertical dimension
CALIPSO observed dust over the Dominican Republic, with the plume reaching roughly 4 km and substantial dust also below 1 km.
The plume reaches farther west
NASA’s retrospective notes elevated fine-particle air-quality indices in parts of the southeastern United States as the event spread beyond the Caribbean.
Basis: NASA Earth Observatory [1] · Copernicus Atmosphere Monitoring Service [2] · European Space Agency [3]
Selected observations & analyses
These entries preserve the source’s reported quantities or analyses. They are not a newly processed observational dataset.
| Evidence | Reported value or finding | Provenance |
|---|---|---|
| Plume height over the Dominican Republic | Approximately 4 km on 23 June | NASA CALIPSO / CALIOP lidar cross-section described by Earth Observatory. |
| Additional near-surface dust | Substantial material at or below 1 km | Same satellite transect; a narrow sampled slice, not a complete map at that height. |
| Distinct evidence products | MODIS AOD, ground AERONET, CALIOP and GEOS model | NASA and Copernicus accounts; observation, retrieval and model output must remain labelled. |
The atmospheric mechanism
Winds lift dust from dry source regions and carry sufficiently small particles away. Some particles settle or are removed along the journey, while remaining material can travel thousands of kilometres. A plan-view image reveals a broad horizontal plume but often cannot tell how high it is. Lidar samples vertically and supplies a complementary slice through the atmosphere.
Aerosol optical depth is dimensionless: it describes the reduction of light along a path, not directly the mass of dust a person breathes at street level. The Copernicus account explains how satellite observations were combined with atmospheric modeling to forecast transport. That combination is valuable, but a model’s smooth complete field should not be mistaken for a direct measurement at every point and every time.
Basis: NASA Earth Observatory [1] · Copernicus Atmosphere Monitoring Service [2] · European Space Agency [3]
What the evidence does not establish
NASA’s June 20 ranking was explicitly a preliminary analysis, so it is not presented here as a formally certified global record. A satellite transect is geographically narrow, and a plume top around 4 km does not imply uniform dust concentration below it. The educational remote-sensing lab uses synthetic pixels; none of its values are recovered observations from this outbreak.
Compare the product before comparing its colors: a photograph-like view, a column retrieval, a vertical transect and a modeled forecast can all depict dust while measuring or estimating different things.
Sources & provenance
- A Dust Plume to Remember NASA Earth Observatory · 2020-07-01Reference only; original paraphrase; no source media reproduced.
- Tracking a massive dust cloud from Africa to America Copernicus Atmosphere Monitoring Service · 2020-06-30Reference only; original paraphrase; no source media reproduced.
- Satellites track unusual Saharan dust plume European Space Agency · 2020-07-09Reference only; original paraphrase; no source media reproduced.
Explanations and diagrams are original educational interpretations. Source institutions have not endorsed or reviewed this publication. How we distinguish evidence from models.