Follow the sequence
The modeled transport develops
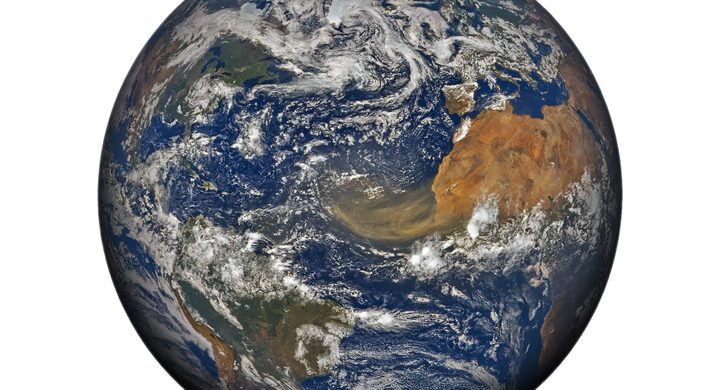
NASA’s GEOS-5 analysis depicts dust moving north from Africa on 14 March. This dated field is a model representation constrained by observations, not a photograph of every particle.
The plume is visible from orbit
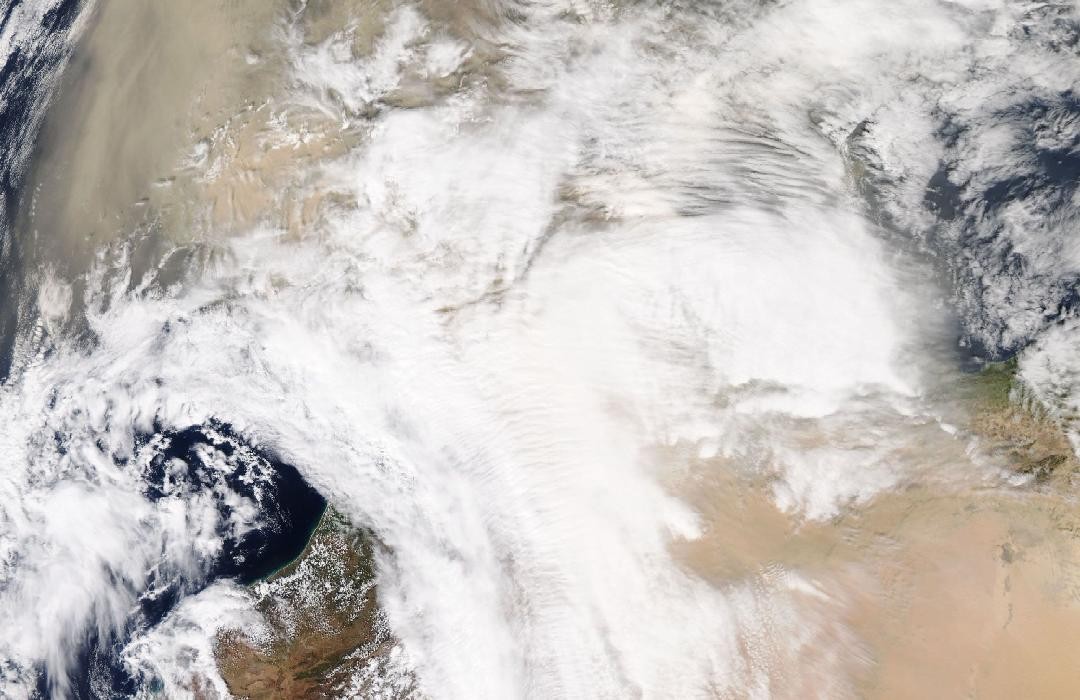
NOAA-20 VIIRS observed dust leaving Algeria and extending across the Iberian Peninsula. Copernicus also documents unusually high particle readings at Spanish surface stations on this date.
Elevated surface particles persist
CAMS’s later spring-2022 evaluation identifies 14–16 March as three consecutive days with daily mean PM10 above 50 micrograms per cubic meter at the assessed Spanish sites.
Basis: NASA Earth Observatory [1] · Copernicus Atmosphere Monitoring Service / ECMWF [2] · Copernicus Atmosphere Monitoring Service / ECMWF [3]
Selected observations & analyses
These entries preserve the source’s reported quantities or analyses. They are not a newly processed observational dataset.
| Evidence | Reported value or finding | Provenance |
|---|---|---|
| Actual satellite acquisition | NOAA-20 VIIRS, 15 March 2022 | NASA Earth Observatory identifies the visible dust plume in an observed spectral image, separate from the GEOS-5 model panels on the same page. |
| Reported hourly surface maximum | 3,782.16 µg/m³ PM10 at El Ejido | 15 March 2022 hourly value reported by CAMS from Spanish/EEA near-real-time observations; preliminary station evidence, not a regional mean or a full-column aerosol amount. |
The atmospheric mechanism
Dust must first be lifted from a susceptible surface, then carried by winds that remain connected to its source. Storm Celia and the surrounding pressure pattern favored strong northward transport in this event. Coarser particles tend to settle more quickly, while smaller particles can remain suspended and travel farther. Rain can remove particles along the route, leaving deposits on surfaces that reveal a different stage of the plume’s history from the airborne haze.
A satellite’s view integrates effects through a substantial depth of atmosphere. A bright or opaque-looking plume can therefore be elevated above cleaner surface air, while a station samples the air at its own intake near the ground. Optical depth, PM10 concentration and a visible image are related but different quantities. Comparing them requires attention to altitude, cloud cover, spatial resolution and observation time. The transport model helps connect those observations across gaps, but its smooth fields should not be mistaken for a dense network of direct measurements.
Basis: NASA Earth Observatory [1] · Copernicus Atmosphere Monitoring Service / ECMWF [2] · Copernicus Atmosphere Monitoring Service / ECMWF [3]
What the evidence does not establish
Some Spanish monitors reached their measurement limits during the outbreak, and the near-real-time observations require their stated quality context. The numerical maximum is an hourly value, not a daily mean. NASA’s discussion of snow-darkening effects also cites a separate 2021 event; those measured changes must not be transferred to this March 2022 case. A single episode does not establish a long-term dust trend.
Match the quantity to the question: use imagery for plume structure, surface stations for local particles, and models for a qualified account of transport between observations.
Sources & provenance
- An Atmospheric River of Dust NASA Earth Observatory · 2022-03-17Reference only; original paraphrase; no source media reproduced.
- “Historic” Saharan dust episode in western Europe: CAMS predictions accurate Copernicus Atmosphere Monitoring Service / ECMWF · Page dated 2022-03-15; includes subsequent episode updatesReference only; original paraphrase; no source media reproduced.
- CAMS evaluation report, March–May 2022: extraordinary dusty spring in Europe Copernicus Atmosphere Monitoring Service / ECMWF · Spring 2022 evaluation; publication date not verifiedReference only; original paraphrase; no source media reproduced.
Explanations and diagrams are original educational interpretations. Source institutions have not endorsed or reviewed this publication. How we distinguish evidence from models.