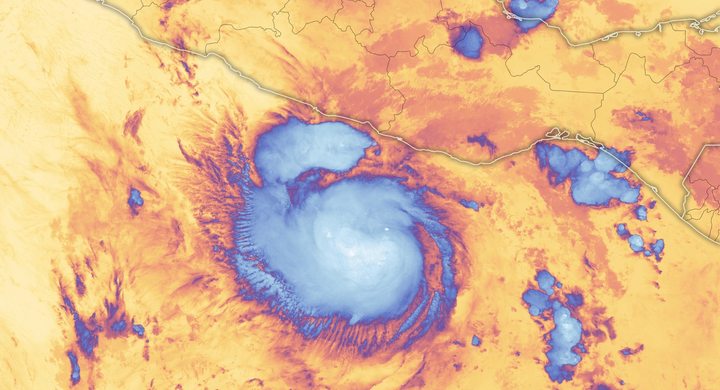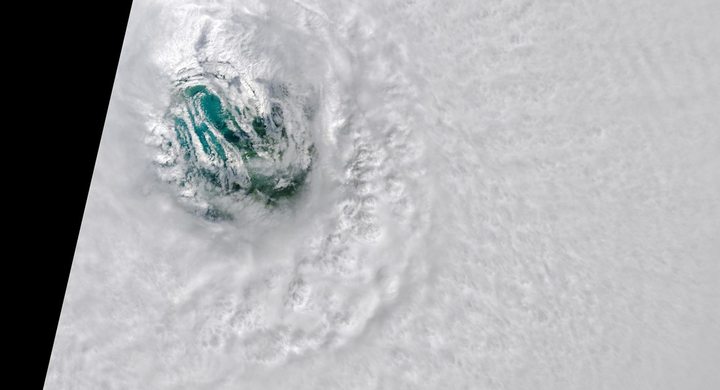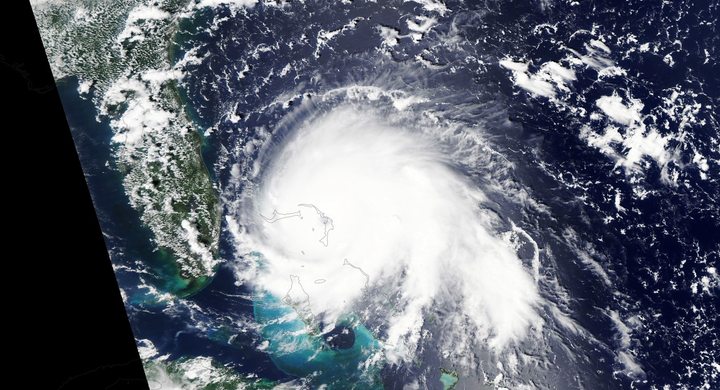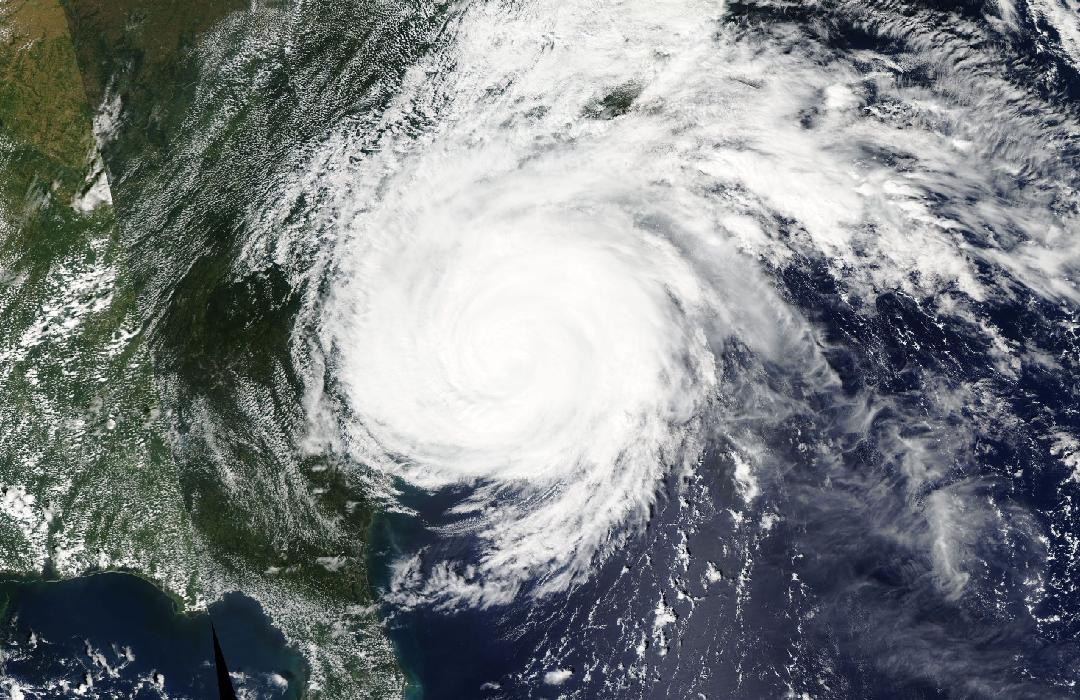
Follow the sequence
Coastal approach
NWS Wilmington’s archived radar sequence follows the approach through 13 September and into the following morning. Rainbands were already affecting land ahead of the center.
Landfall near Wrightsville Beach
NHC places landfall at 11:15 UTC with estimated maximum sustained winds of 80 knots. The center then moved slowly across southeastern North Carolina toward South Carolina.
An inland system
Florence moved north through the Appalachians and became extratropical over western West Virginia by 12:00 UTC, according to the final NHC reconstruction.
End of the regional accumulation analysis
The NOAA rainfall analysis covers 13–18 September, including the extratropical phase. Its multi-day totals should not be read as rainfall confined to the landfall morning.
Basis: NOAA National Hurricane Center [1] · NOAA National Weather Service, Wilmington [2] · NOAA National Weather Service [3]
Selected observations & analyses
These entries preserve the source’s reported quantities or analyses. They are not a newly processed observational dataset.
| Evidence | Reported value or finding | Provenance |
|---|---|---|
| Reported rainfall maximum | 35.93 inches near Elizabethtown, North Carolina | NHC and NWS Wilmington storm-total assessment; NOAA’s regional rainfall map spans 13–18 September 2018. |
| Landfall wind estimate | 80 kt maximum sustained | NHC analysis at 11:15 UTC on 14 September, informed by Doppler radar and reconnaissance; not a direct surface measurement at every coastal site. |
The atmospheric mechanism
The rainfall total at a location is the sum of its rain rates over time. A slow-moving cyclone can deliver repeated bursts even when individual cells are moving quickly around it. This is rainband training: a sequence of cells follows a similar route across the ground. Florence’s broad circulation continued drawing moist air off the Atlantic, while slow forward motion kept the supply and lifting near the Carolinas for an extended period.
The downstream response introduces another clock. Rain falling across a catchment moves into small channels, tributaries and then larger rivers. The river crest can therefore arrive after local rain has eased. Urban drainage, already wet soils, the size of the catchment and storage on floodplains all influence that delay. These are useful mechanisms for reading an event chronology, but they do not allow a rainfall total at one gauge to predict the height of every downstream river or the time when a road will reopen.
Basis: NOAA National Hurricane Center [1] · NOAA National Weather Service, Wilmington [2] · NOAA National Weather Service [3]
What the evidence does not establish
A storm-total maximum represents one observing location and accumulation window. It is not an average over either state, and it does not identify the most intense hour. NHC describes the rainfall pattern using multiple data sources; radar maps retain estimation uncertainty. The storm’s Category 1 landfall describes maximum wind and carries no numerical information about freshwater flood severity.
Track how often rain returns and how long the moisture supply persists, then allow for rivers to respond after the atmosphere has moved on.
Sources & provenance
- Tropical Cyclone Report: Hurricane Florence NOAA National Hurricane Center · 2019-09-25, updated reportReference only; original paraphrase; no source media reproduced.
- Hurricane Florence: September 14, 2018 NOAA National Weather Service, Wilmington · Event summary; publication date not statedReference only; original paraphrase; no source media reproduced.
- Hurricanes Florence and Michael service assessment NOAA National Weather Service · 2020-04Reference only; original paraphrase; no source media reproduced.
Explanations and diagrams are original educational interpretations. Source institutions have not endorsed or reviewed this publication. How we distinguish evidence from models.