Follow the sequence
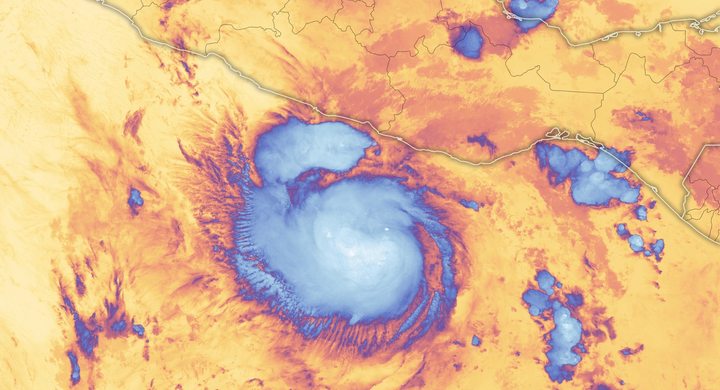
A hurricane south of Cayman
NHC places Ian’s attainment of hurricane strength at 06:00 UTC. Warm water and low vertical wind shear supported continued strengthening toward Cuba.
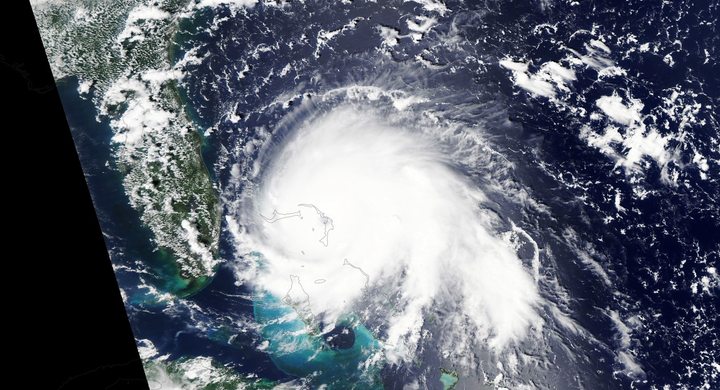
Western Cuba crossing
Ian made landfall near La Coloma at 08:30 UTC with an estimated intensity of 110 knots, then emerged over the southeastern Gulf later that day.
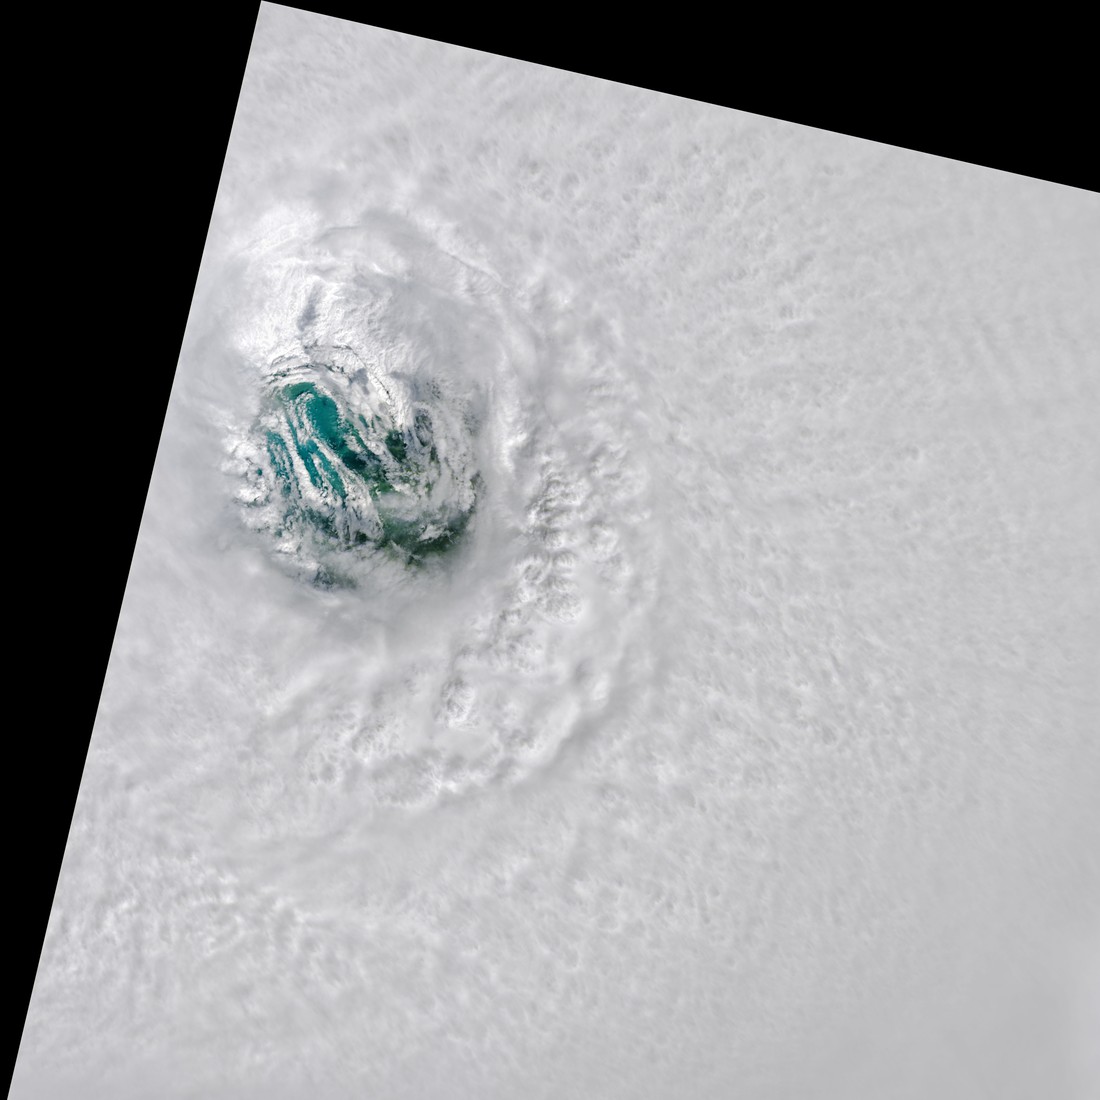
Peak offshore, then Florida
The final analysis gives a 140-knot peak at 12:00 UTC, followed by 130-knot landfall at Cayo Costa at 19:05 UTC and 125-knot mainland landfall near Punta Gorda at 20:35 UTC.
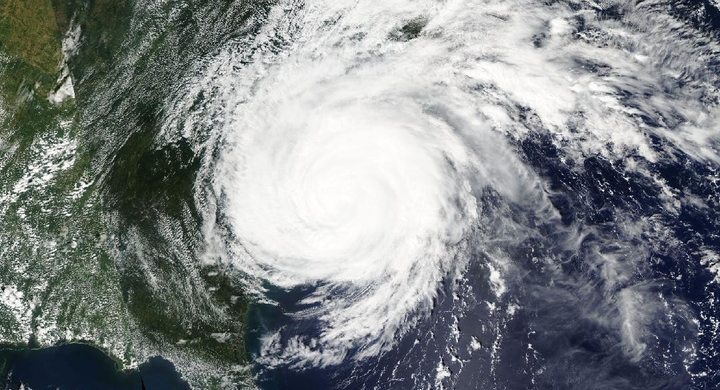
Another coast
After crossing Florida and regaining hurricane strength over the Atlantic, Ian reached the coast near Georgetown, South Carolina, at 18:05 UTC with estimated 70-knot winds.
Selected observations & analyses
These entries preserve the source’s reported quantities or analyses. They are not a newly processed observational dataset.
| Evidence | Reported value or finding | Provenance |
|---|---|---|
| Peak offshore intensity | 140 kt; 937 hPa | NHC post-event estimate for 12:00 UTC on 28 September 2022, using reconnaissance and reprocessed surface-wind retrievals. |
| Cayo Costa landfall estimate | 130 kt maximum sustained | NHC analysis for 19:05 UTC on 28 September; the published report explains adjustments for aircraft sampling and the large radius of maximum wind. |
The atmospheric mechanism
An eyewall replacement over the Gulf widened Ian’s region of strongest winds. For coastal interpretation, the footprint of strong onshore flow matters alongside the maximum speed. Wind transfers momentum to water, and a shoreline facing that flow can accumulate water differently from a nearby coast facing away. The broad circulation, continental shelf and bays determine how that forcing is translated into coastal water levels; the center track alone cannot supply that information.
The Florida crossing also illustrates how hazards evolve after landfall. Friction and loss of a sustained ocean energy supply weaken a cyclone, yet its moist circulation can continue producing heavy rain inland. Returning over water can support renewed development if the surrounding atmosphere remains favorable. Consequently, the date and place must accompany every intensity number. Ian’s offshore Category 5 peak, Florida Category 4 landfall and weaker South Carolina landfall are different states, not conflicting descriptions of a single unchanged storm.
What the evidence does not establish
The current NHC report, updated in March 2026, removes a set of mixed measured-and-derived station records. This case uses the report’s analyzed intensity values, not those removed observations. Estimates have uncertainty, and instrument failures limited direct sampling near the Florida coast. A wind category is not a surge-height class or a rainfall forecast for an inland town.
Attach every hurricane intensity to a time and place, and read the changing wind footprint and coastline before comparing the hazards of different landfalls.
Sources & provenance
- Tropical Cyclone Report: Hurricane Ian NOAA National Hurricane Center · 2026-03-12, updated reportReference only; original paraphrase; no source media reproduced.
Explanations and diagrams are original educational interpretations. Source institutions have not endorsed or reviewed this publication. How we distinguish evidence from models.