Follow the sequence
A depression forms
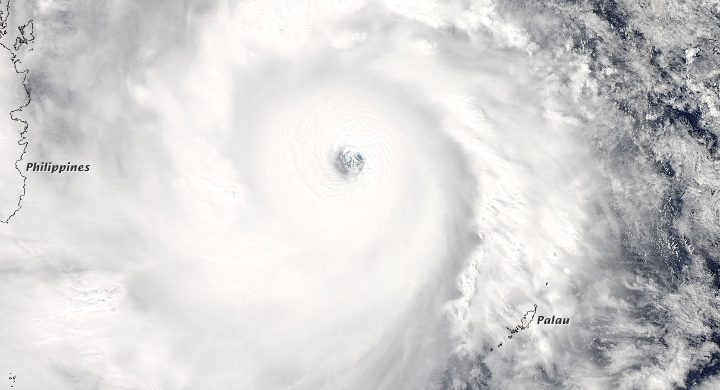
RSMC Tokyo places tropical-depression formation at 18:00 UTC south of Wake Island. This is the retrospective best-track chronology.
Oceanic intensity peaks
JMA’s report gives the peak analyzed intensity near the Mariana Islands. The later Japanese rain maximum occurred after this phase.
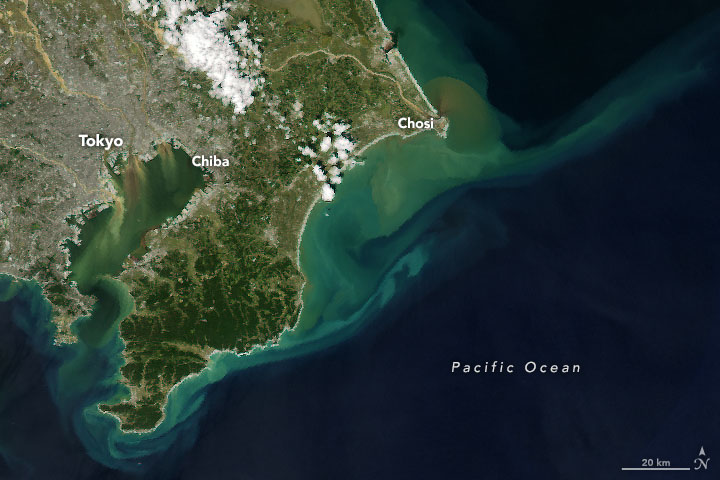
Landfall and exceptional rain
Hagibis made landfall on the Izu Peninsula before 10:00 UTC. Hakone’s daily rainfall reached 922.5 mm on the Japanese local calendar date.
The storm changes structure
JMA identifies extratropical transition by 03:00 UTC southeast of Hokkaido, after the storm crossed eastern Japan.
Basis: Japan Meteorological Agency [1] · Japan Meteorological Agency [2] · NASA Earth Observatory [3]
Selected observations & analyses
These entries preserve the source’s reported quantities or analyses. They are not a newly processed observational dataset.
| Evidence | Reported value or finding | Provenance |
|---|---|---|
| Hakone daily rain | 922.5 mm on 12 October | JMA daily observations; local calendar-day amount, not the maximum rolling 24-hour value. |
| Peak central pressure | 915 hPa on 7 October, 12:00 UTC | JMA RSMC Tokyo best-track analysis; offshore peak, not landfall pressure. |
| Landfall location | Izu Peninsula | JMA retrospective cyclone report; before 10:00 UTC on 12 October. |
The atmospheric mechanism
The broad cyclone circulation supplied moisture and ascent, with Japan’s terrain helping focus precipitation. A decreasing maximum wind does not imply that every rainband weakens or that the rain area shrinks in parallel. Tropical cyclones also interact with their midlatitude environment as they move north. The structure, moisture transport and movement all matter to the eventual distribution.
Try comparing two hypothetical storms with the same peak wind but different translation speeds and sizes. A point beneath the slower or broader rain shield can stay wet longer. That comparison isolates a reason categories cannot predict rainfall totals, but it is not a reconstruction of Hagibis. To assess the real event, pair the JMA track with time-resolved gauges and radar rather than selecting only the strongest-looking satellite image.
Basis: Japan Meteorological Agency [1] · Japan Meteorological Agency [2] · NASA Earth Observatory [3]
What the evidence does not establish
The 922.5 mm figure is a calendar-day total. Other Hagibis publications quote larger rolling 24-hour or whole-event values; these are different statistics rather than automatically contradictory measurements. JMA’s intensity conventions also differ from some overseas agencies. This case does not convert between agencies’ wind-averaging periods or claim the listed pressure was measured by a station under the eye.
Keep wind intensity, rainfall amount, duration and storm size on separate lines. An apparent weakening on one line does not guarantee the other lines become less consequential.
Sources & provenance
- Annual Report on the Activities of RSMC Tokyo – Typhoon Center 2019: Hagibis Japan Meteorological Agency · 2019 reportReference only; original paraphrase; no source media reproduced.
- Daily weather charts and overview, October 2019 Japan Meteorological Agency · 2019-10Reference only; original paraphrase; no source media reproduced.
- Hagibis Floods Japan NASA Earth Observatory · 2019-10Reference only; original paraphrase; no source media reproduced.
Explanations and diagrams are original educational interpretations. Source institutions have not endorsed or reviewed this publication. How we distinguish evidence from models.