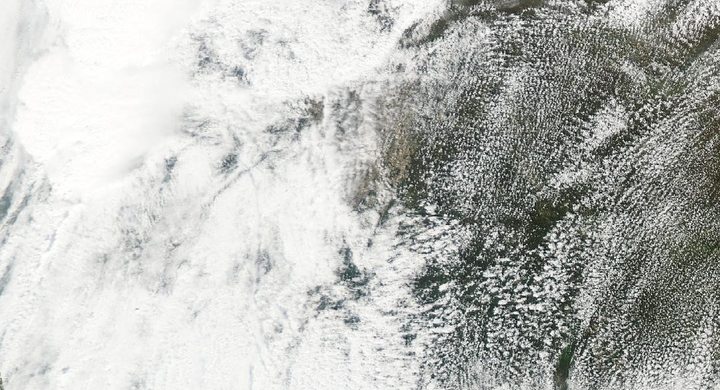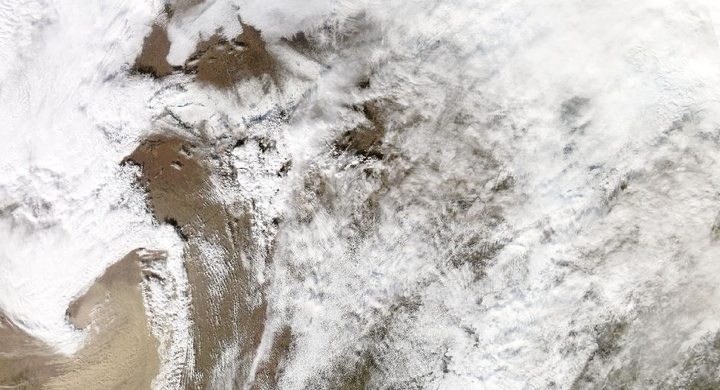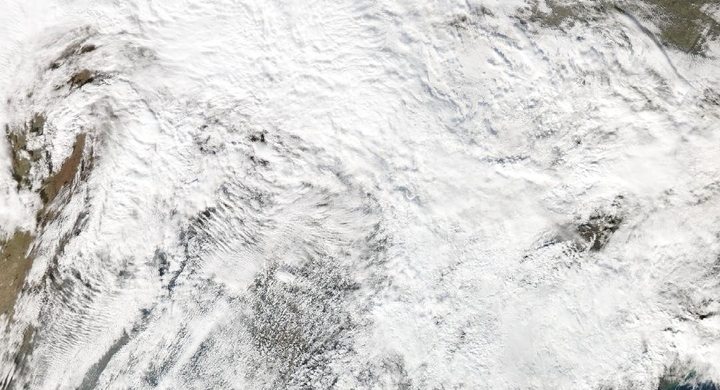
Follow the sequence
A large-scale environment develops
The NWS Northern Indiana reconstruction places a deep surface cyclone over Kansas in the morning. Warm, moist air spread into the Ohio Valley ahead of the system, beneath winds that changed strongly with height.
Separate storms produce separate tracks
During the afternoon and evening, numerous supercells developed across the warm sector. The Indianapolis account distinguishes an early Boone County tornado from the later main Indiana outbreak; a single daily map combines events that did not happen simultaneously.
The outbreak continues overnight
Tornadoes continued into the following morning as the storm system progressed. The historical outbreak window spans roughly a day across a broad region; it is not the lifetime of any individual tornado.
Basis: NOAA National Weather Service, Indianapolis [1] · NOAA National Weather Service, Northern Indiana [2]
Selected observations & analyses
These entries preserve the source’s reported quantities or analyses. They are not a newly processed observational dataset.
| Evidence | Reported value or finding | Provenance |
|---|---|---|
| Historical outbreak count | 148 tornadoes in the NWS historical summary | NWS Indianapolis and Northern Indiana retrospective accounts of 3–4 April; a historical catalogue count, dependent on the event definition and available reports. |
| Long damage track | Approximately 109 miles / 175 km for the Monticello tornado | NWS Northern Indiana anniversary material; reconstructed damage-path length, not a direct measurement of wind speed or the width of every damaged area. |
The atmospheric mechanism
Buoyancy and wind shear answer different questions. Warm, humid low-level air can become positively buoyant when lifted, supplying energy for rising motion. Changes in wind speed and direction with height help organize that convection. A long-lived rotating updraft can keep drawing in undisturbed air instead of immediately being smothered by its own cooled outflow. Neither ingredient, considered alone, identifies where a tornado will form.
Read an outbreak map at two scales. The cyclone and its surrounding air masses explain why a large region supported storms. Each individual track then requires storm-scale observations and a damage survey. Connecting nearby track endpoints into one enormous tornado would erase intervals when no tornado was documented. The storms lab separates lift from a simplified buoyancy profile, but it cannot reproduce the rotating updrafts or calculate the tornado paths in this case.
Basis: NOAA National Weather Service, Indianapolis [1] · NOAA National Weather Service, Northern Indiana [2]
What the evidence does not establish
Historical F-scale ratings were based on damage evidence and used different wind relationships from the later Enhanced Fujita scale. Reporting coverage, building exposure and survey methods also changed over subsequent decades. Comparing total counts with a modern outbreak therefore does not isolate a change in the atmosphere, and the largest rating is not a wind measured throughout an entire track.
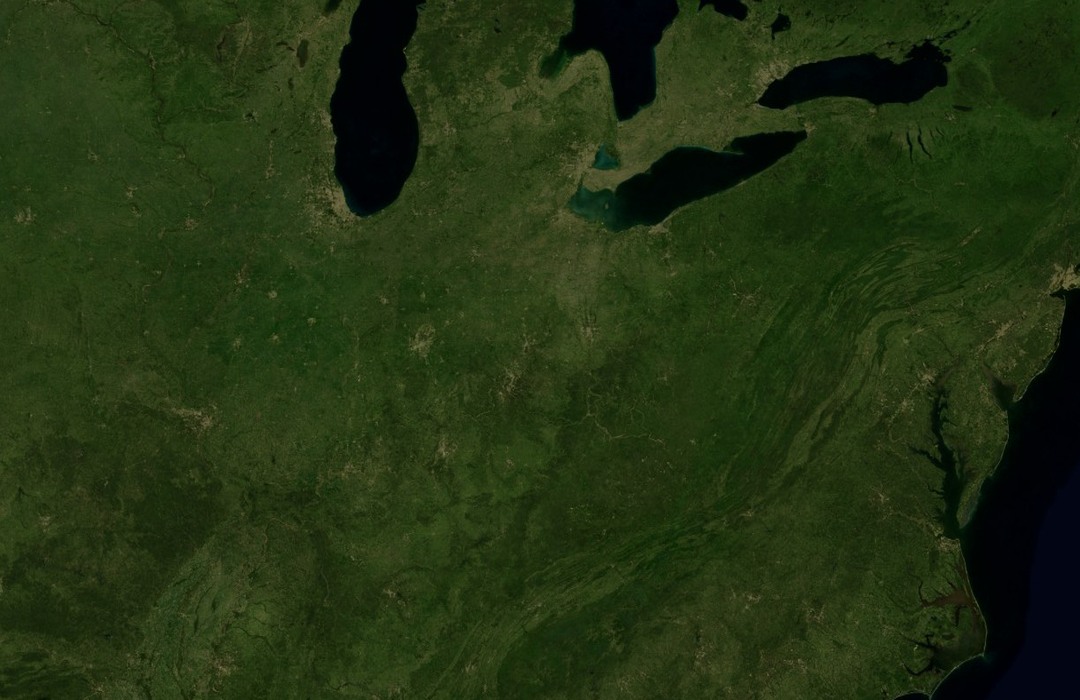
Use the regional map to understand the shared environment, then return to dated individual tracks before describing a tornado’s duration or footprint.
Sources & provenance
- April 3, 1974 Super Outbreak NOAA National Weather Service, Indianapolis · Publication date not statedReference only; original paraphrase; no source media reproduced.
- April 3rd 1974 Super Outbreak: 50th Anniversary NOAA National Weather Service, Northern Indiana · 2024 anniversary retrospectiveReference only; original paraphrase; no source media reproduced.
Explanations and diagrams are original educational interpretations. Source institutions have not endorsed or reviewed this publication. How we distinguish evidence from models.