Follow the sequence
A moist flow persists
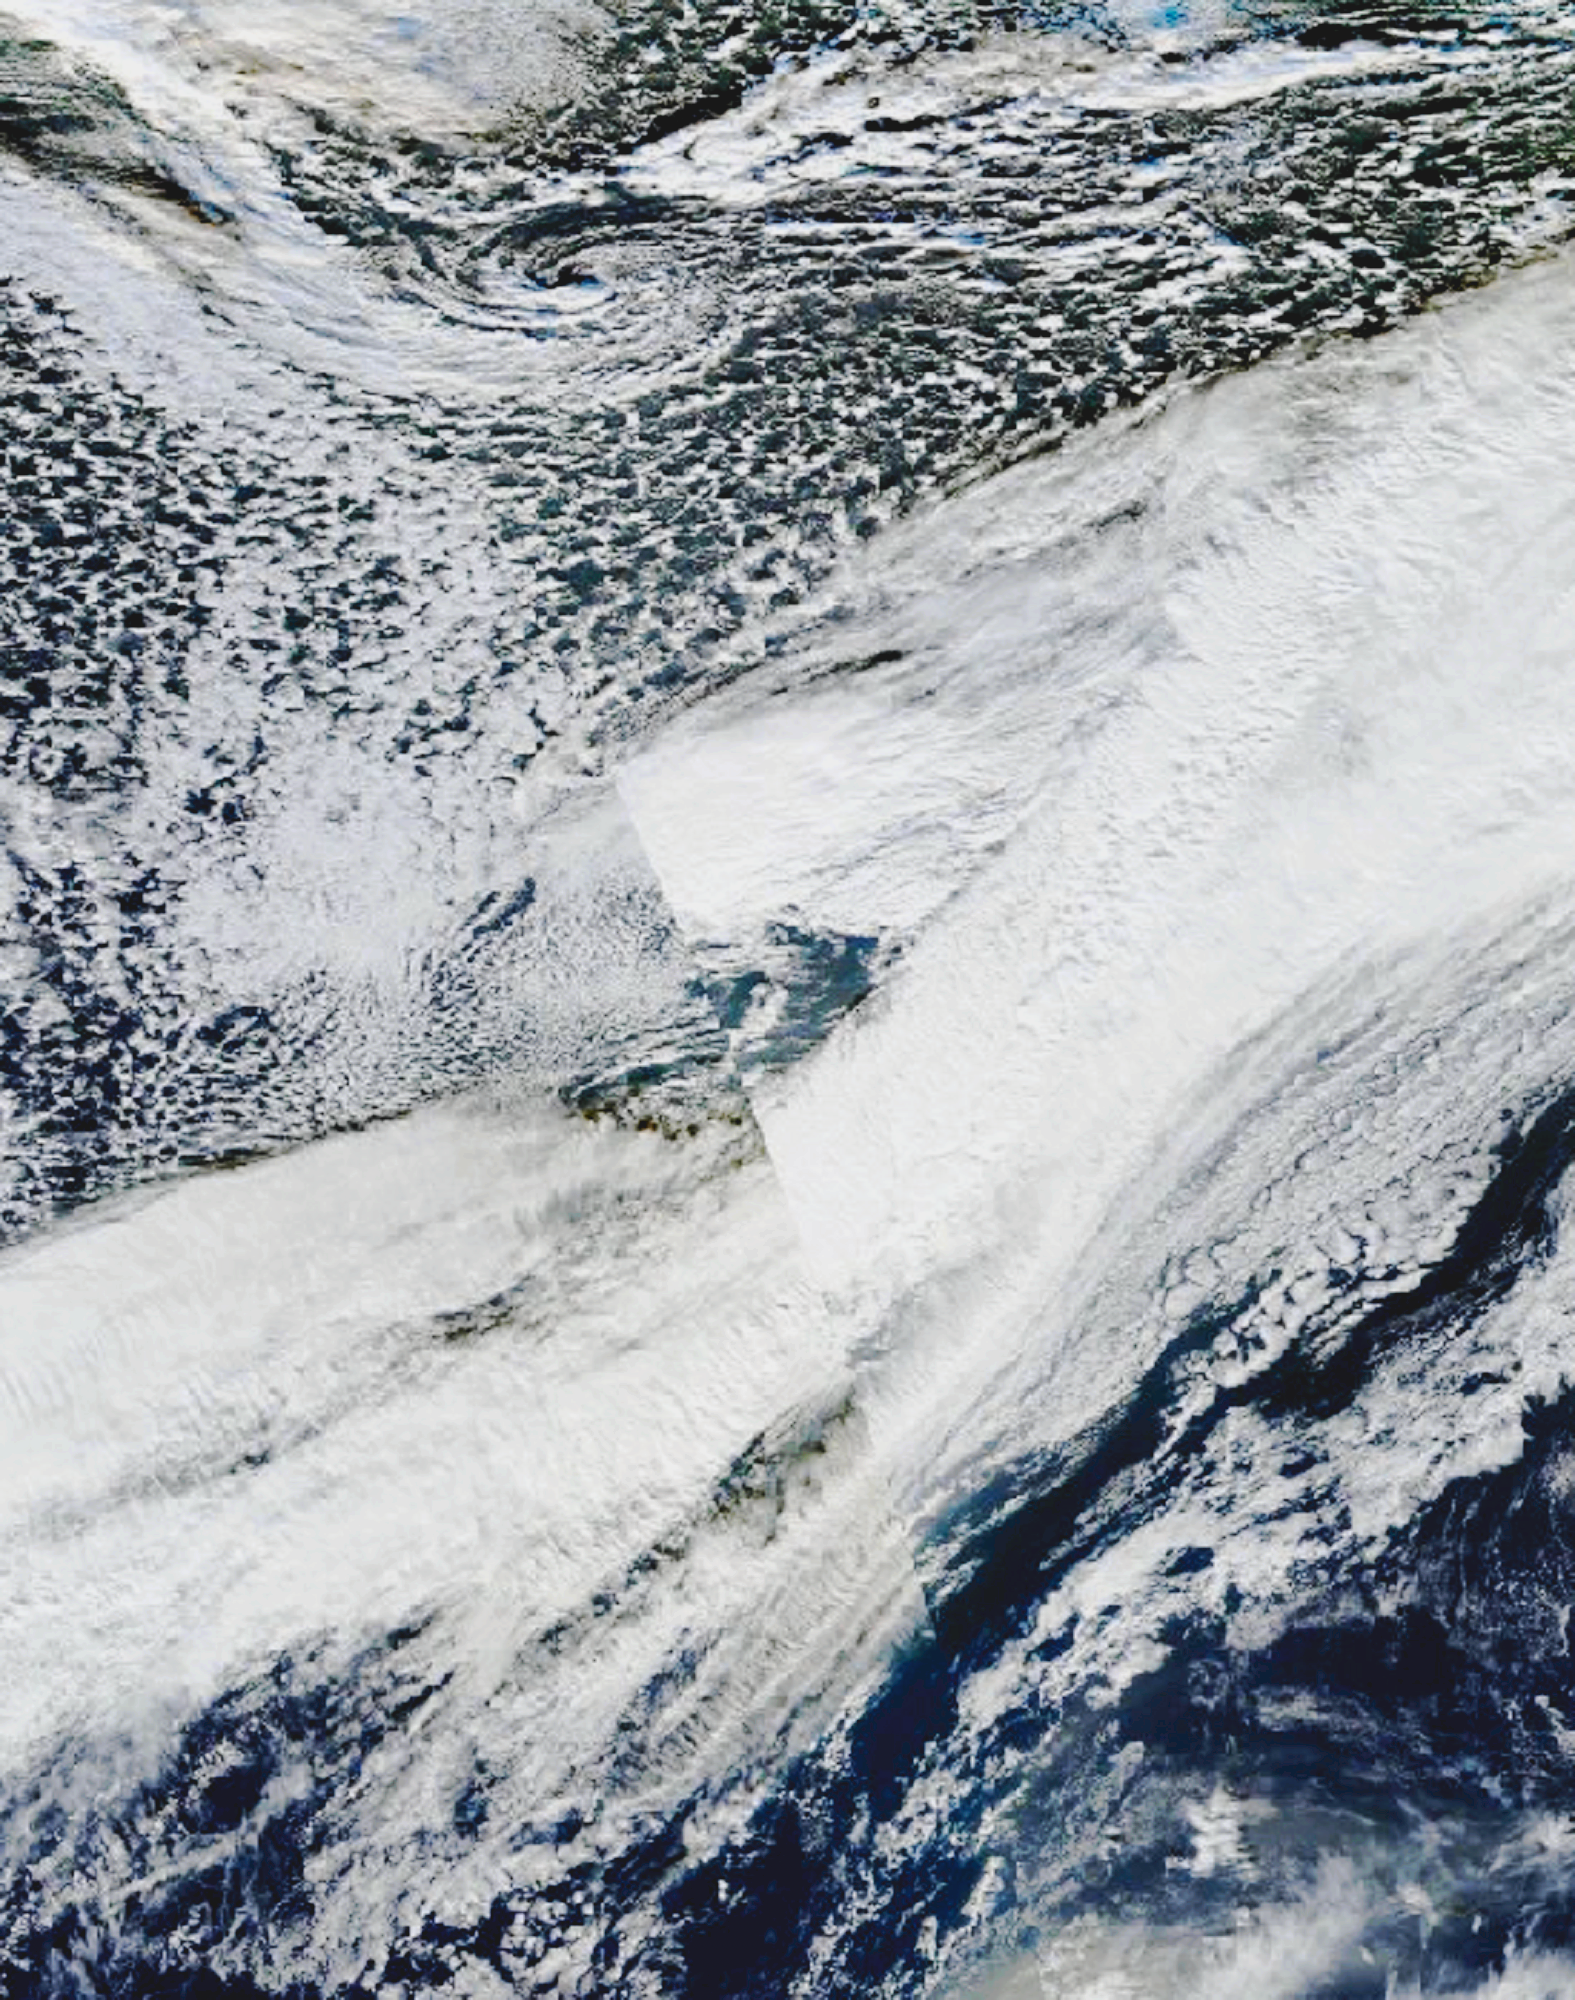
Storm Desmond brought a sustained southwest flow toward north-west Britain. The event should be read as a prolonged delivery of moisture, not one isolated shower.
A measured 24-hour accumulation
The Honister Pass gauge accumulated 341.4 mm in the period ending at 18:00 GMT. That window crosses two calendar dates.
Longer totals reveal persistence
The wider episode produced exceptional multi-day totals and flooding. Rainfall windows of different length answer different questions and should remain separately labelled.
Selected observations & analyses
These entries preserve the source’s reported quantities or analyses. They are not a newly processed observational dataset.
| Evidence | Reported value or finding | Provenance |
|---|---|---|
| Honister Pass rainfall | 341.4 mm in 24 h ending 5 December, 18:00 GMT | Met Office, 7 December 2015 event discussion. |
| Moisture pathway | Persistent southwesterly flow from the Atlantic | Met Office synoptic interpretation; an inferred transport pathway, not a dye-tracer experiment. |
| Landscape context | Cumbrian uplands | Gauge location and official event description; rainfall varies strongly with exposure. |
The atmospheric mechanism
The Met Office described an extended corridor of moisture feeding the event. Air approaching uplands is forced upward; cooling during ascent can increase condensation and precipitation. Persistent delivery matters because the same slopes can remain beneath this process for many hours. The hills do not create the incoming water, and a moist airflow without sustained lifting would not yield the same distribution.
In the mountain lab, increase barrier height while retaining the same incoming temperature and dew point. The resulting changes show a controlled parcel response, not Desmond’s reconstructed rainfall. In reality, wind speed and direction, cloud microphysics, frontal ascent and upstream precipitation all affect which slopes are wettest. A summit gauge is therefore neither a lowland proxy nor a map of an entire catchment.
What the evidence does not establish
This record applies to the stated 24-hour window. Adding an extra hour, switching to a calendar day, or comparing with a 48-hour total changes the statistic. The contemporaneous Met Office discussion was cautious about attribution. A physically plausible warmer-air contribution alone does not establish how much of this particular total was caused by human influence.
Think of heavy mountain rain as a supply problem and a lifting problem together. Identify both, then check that compared rainfall values use the same accumulation period.
Sources & provenance
- Did climate change have an impact on Storm Desmond? Met Office Press Office · 2015-12-07Reference only; original paraphrase; no source media reproduced.
- State of the UK Climate 2015 Met Office · 2016Reference only; original paraphrase; no source media reproduced.
Explanations and diagrams are original educational interpretations. Source institutions have not endorsed or reviewed this publication. How we distinguish evidence from models.