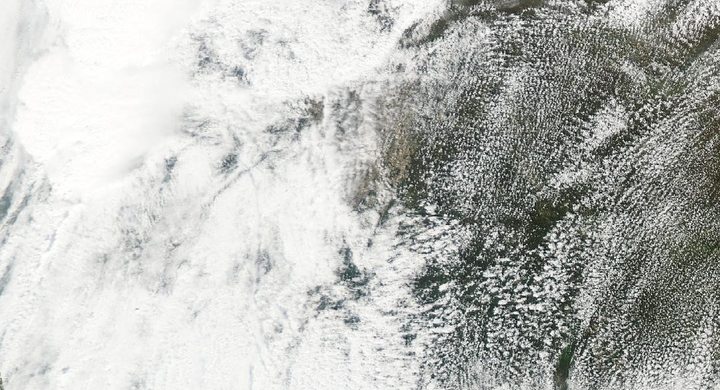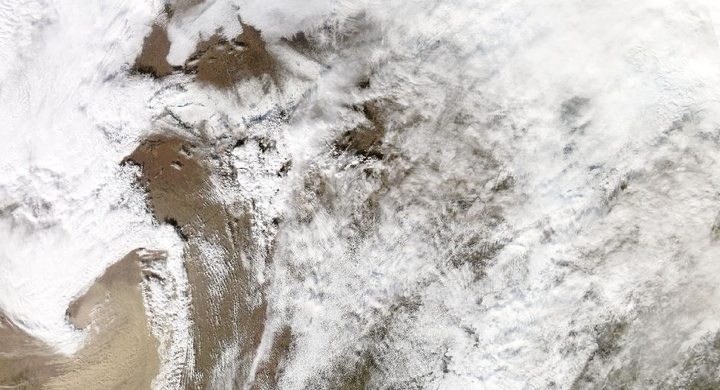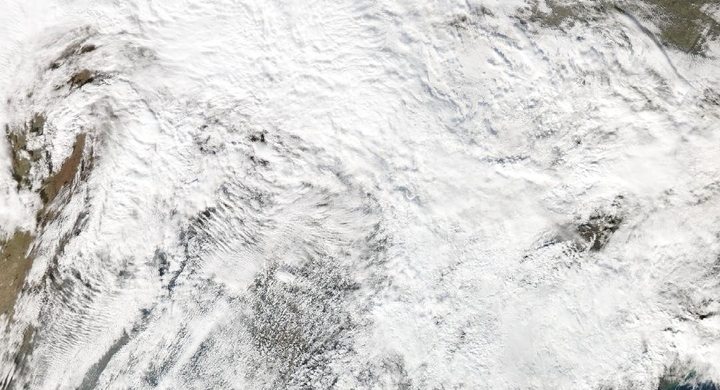
Follow the sequence
Multiple supercells develop in the southern Plains
NWS Norman documents numerous damaging tornadoes during the late afternoon and evening in central Oklahoma, with additional severe storms in southern Kansas. More than one storm and tornado were active within the regional environment.
The Bridge Creek–Moore tornado crosses populated areas
NOAA’s National Severe Storms Laboratory describes the strongest tornado’s route through communities south and east of Oklahoma City. Its assessed F5 damage was part of a much broader outbreak containing tornadoes of different intensities.
Tornado activity continues farther east
The Norman event summary records additional tornadoes into the morning and early afternoon. A calendar-day count for 3 May therefore captures a different interval from the complete 3–4 May Plains episode.
The storm system produces a later squall line
NWS Nashville links a powerful evening line of thunderstorms to the same large-scale system after its passage through the Plains. Tornadoes and damaging weather continued into early 6 May in that later regional phase.
Basis: NOAA National Weather Service, Norman [1] · NOAA National Severe Storms Laboratory [2] · NOAA National Weather Service, Nashville [3]
Selected observations & analyses
These entries preserve the source’s reported quantities or analyses. They are not a newly processed observational dataset.
| Evidence | Reported value or finding | Provenance |
|---|---|---|
| Plains outbreak count | 74 tornadoes across Oklahoma and Kansas in less than 21 hours | NOAA National Severe Storms Laboratory historical account; the stated two-state scope differs from larger regional or multi-day catalogues. |
| Strongest tornado’s assessed route | Approximately 38 miles / 61 km; maximum F5 rating | NOAA NSSL historical summary of the Bridge Creek–Moore tornado; path length and damage classification, not a uniform wind across the entire route. |
The atmospheric mechanism
A dryline and other boundaries can focus rising motion where warm, moist air is available. Once thunderstorms develop, the environmental wind profile influences their organization and movement. Several supercells may draw on the same large-scale reservoir at once, yet each has its own inflow, precipitation region and possible tornado cycle. Counting storms, tornado reports and surveyed tornadoes therefore produces different quantities.
As the larger weather system progresses, the balance of forcing and storm interactions can change. A later line organizes convection differently from the earlier isolated supercells, even though both phases are connected to the same synoptic system. Following that transition is more informative than extending the most famous tornado’s arrow across a regional map. The storms lab isolates parcel buoyancy and imposed lift; it does not model dryline placement, storm mergers or the transition to a squall line.
Basis: NOAA National Weather Service, Norman [1] · NOAA National Severe Storms Laboratory [2] · NOAA National Weather Service, Nashville [3]
What the evidence does not establish
The original Fujita scale used in 1999 is not identical to the Enhanced Fujita scale adopted later. Historical totals depend on their time and geographic boundaries, and successive reports can describe the same tornado. The four-day case window follows the broader system; it is explicitly longer than either the strongest tornado’s life or the primary Oklahoma–Kansas outbreak.
State the time window, geographic domain and counted object before comparing outbreak totals or linking damage tracks across successive days.
Sources & provenance
- The Great Plains Tornado Outbreak of May 3–4, 1999 NOAA National Weather Service, Norman · Publication date not statedReference only; original paraphrase; no source media reproduced.
- May 3, 1999 Oklahoma/Kansas Tornado Outbreak NOAA National Severe Storms Laboratory · Publication date not statedReference only; original paraphrase; no source media reproduced.
- May 5, 1999 Tornado Outbreak NOAA National Weather Service, Nashville · Publication date not statedReference only; original paraphrase; no source media reproduced.
Explanations and diagrams are original educational interpretations. Source institutions have not endorsed or reviewed this publication. How we distinguish evidence from models.