Follow the sequence
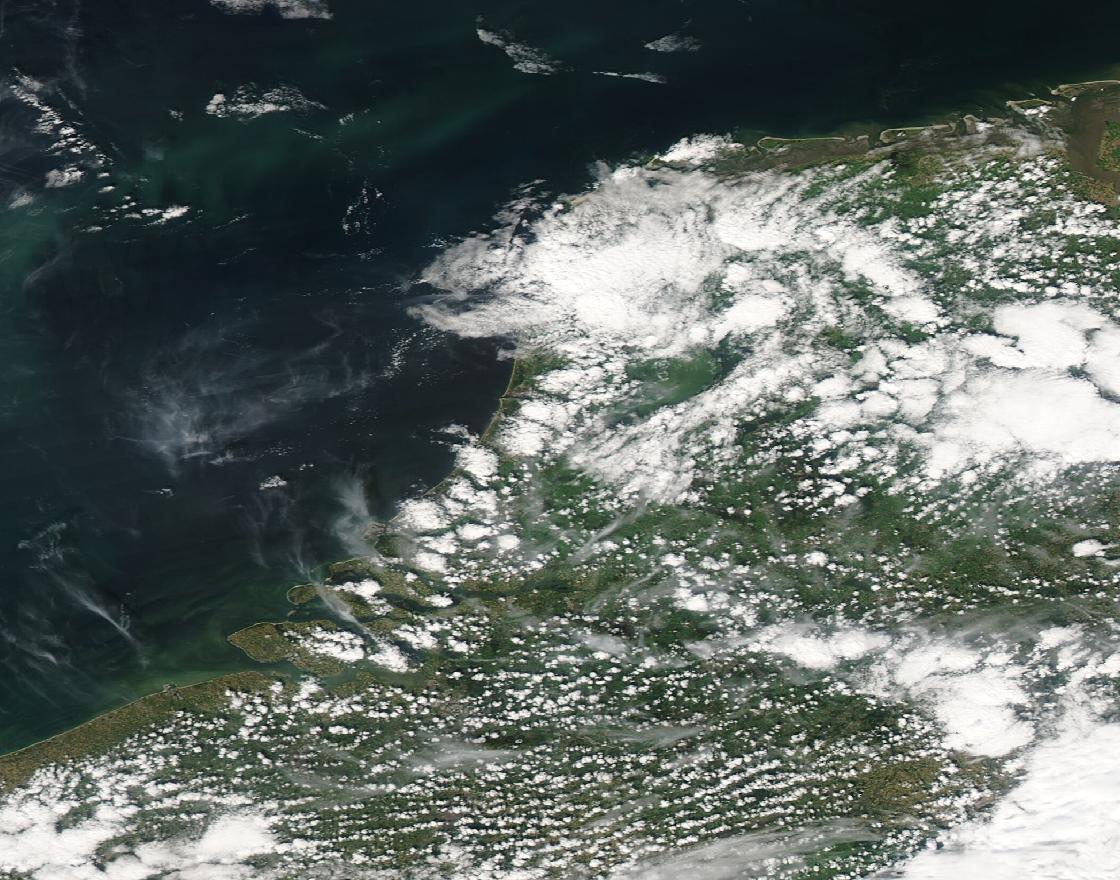
12:00 UTC · coastal boundaries
EUMeTrain identifies sea-breeze fronts around the Netherlands in a Meteosat 9 image. This is the satellite acquisition time, not the later time of passage at each station.
13:00–14:00 UTC · Schiphol passage
The airport record shows a small temperature fall, a clockwise wind shift and increasing relative humidity. EUMeTrain identifies their coincidence as the front passing.
By 18:00 UTC · arrival at Cabauw
Farther inland, wind direction changes almost together at the measured tower levels. The source places the sea-breeze front at Cabauw by this time.
Basis: EUMeTrain / SatManu, using KNMI observations [1] · NOAA JetStream [2]
Selected observations & analyses
These entries preserve the source’s reported quantities or analyses. They are not a newly processed observational dataset.
| Evidence | Reported value or finding | Provenance |
|---|---|---|
| Surface sampling | 10-minute averages | Schiphol meteorogram described by EUMeTrain; instrument records, not hourly forecast values. |
| Tower wind observations | 10, 20, 40, 80, 140 and 200 m | KNMI Cabauw observations reproduced and interpreted by EUMeTrain. |
| Eastward advance | About 8 km/h | EUMeTrain event analysis; approximate frontal motion, not wind speed. |
The atmospheric mechanism
Land and water respond differently to daytime heating. When landward air becomes warmer than adjacent marine air, the resulting pressure differences can support an onshore flow near the surface and a return flow aloft. The advancing marine air can lift warmer inland air along a sea-breeze front. This is a local circulation whose strength and inland reach depend on the wider weather pattern. NOAA’s explanation also shows why an opposing background wind can restrain its advance, while a favorable wind can help it move inland.
The useful reasoning exercise is to compare independent variables. A wind shift alone has several possible explanations; a temperature change alone does too. Their timing together with humidity provides a stronger diagnostic combination. Next compare stations rather than treating a coastal observation as a statement about every inland location. The later arrival is evidence that the boundary moved through the region, rather than changing the whole region simultaneously.
Basis: EUMeTrain / SatManu, using KNMI observations [1] · NOAA JetStream [2]
What the evidence does not establish
The tower samples only the lowest 200 m: these records do not establish the entire return circulation above it. The approximate propagation speed is not a constant to insert into every coastal forecast. No numerical temperature drop or rain amount is inferred here from the illustrated traces. In the laboratory, changing the heating contrast explores a mechanism; it does not reconstruct this day’s measured energy budget.
Keep three speeds separate: the wind felt at a station, the inland movement of a boundary, and the changing circulation in a teaching animation. They describe different things and need different evidence.
Sources & provenance
- Sea Breeze — Weather Events EUMeTrain / SatManu, using KNMI observations · Publication date not stated; page carries copyright 2014Reference only; original paraphrase; no source media reproduced.
- The Sea Breeze NOAA JetStream · Publication date not statedReference only; original paraphrase; no source media reproduced.
Explanations and diagrams are original educational interpretations. Source institutions have not endorsed or reviewed this publication. How we distinguish evidence from models.