Follow the sequence
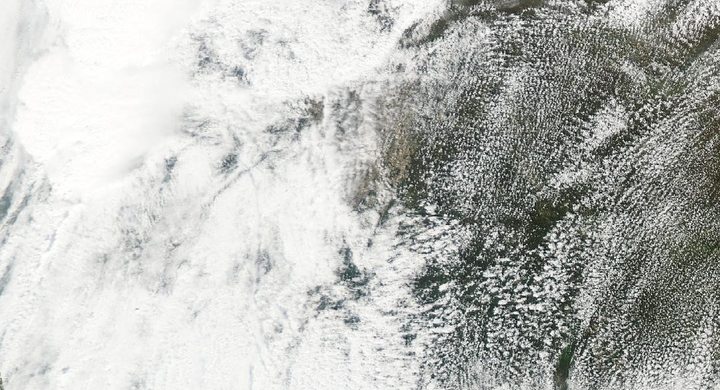
A supercell approaches from the west
The NWS retrospective describes a hot, humid Sunday afternoon and a supercell moving from extreme southeastern Kansas toward southwestern Missouri. The broad storm environment existed before the compact tornado circulation crossed the city.
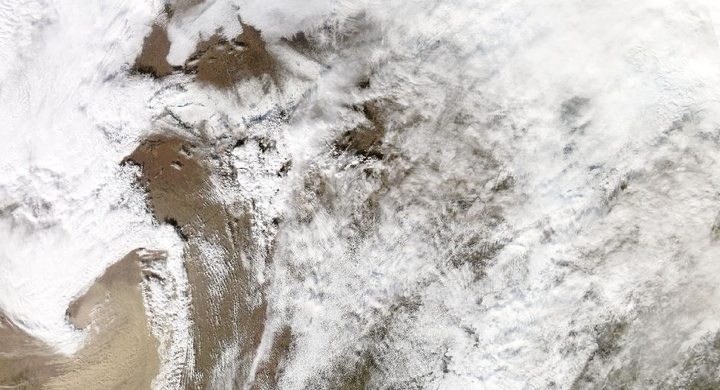
A violent tornado crosses Joplin
The NWS Central Region service assessment documents the evening tornado and its warning timeline. The eventual EF5 classification describes the most severe assessed damage, not a uniform wind applied to every neighborhood under the parent thunderstorm.
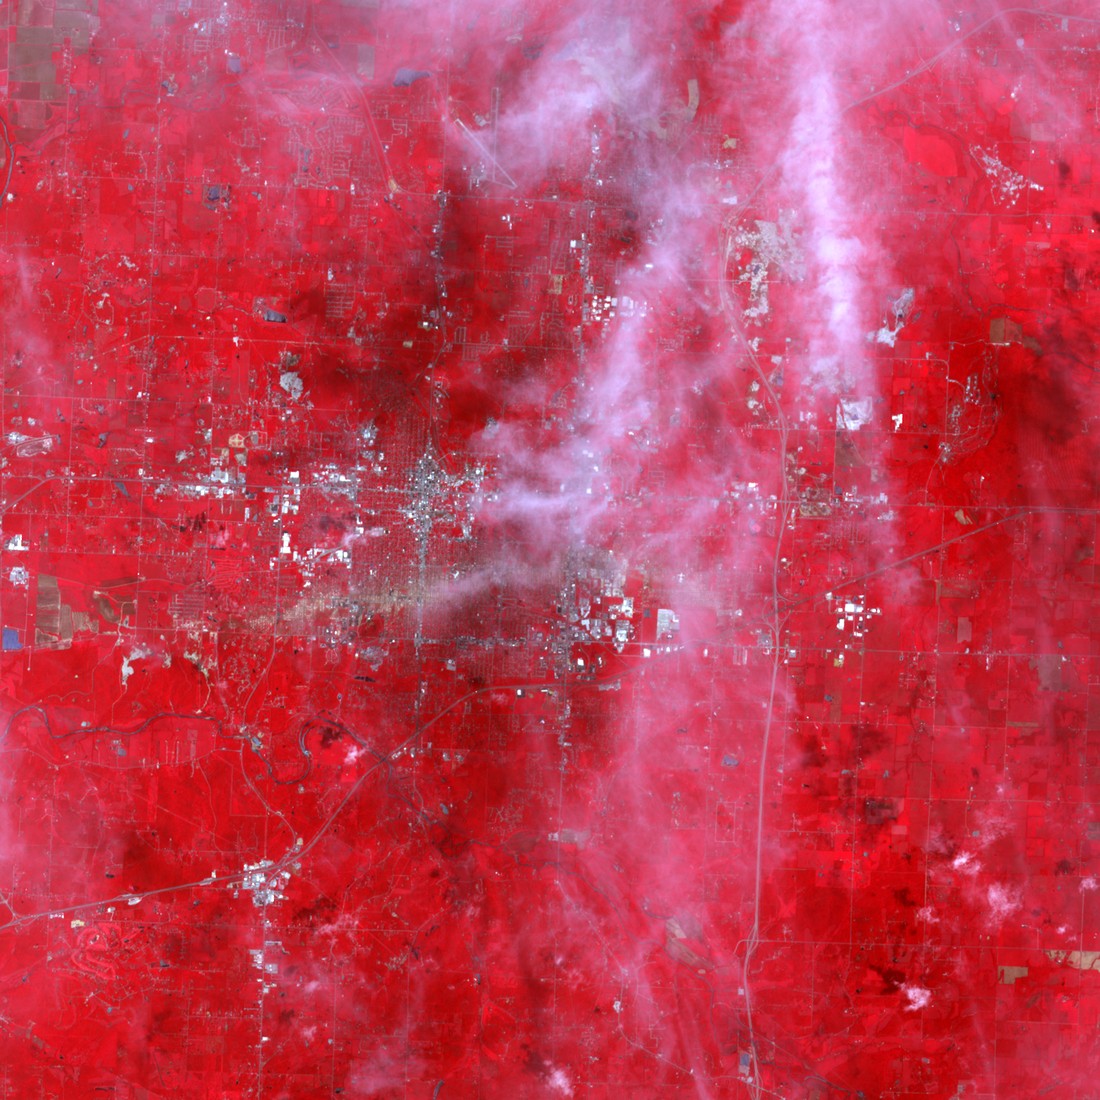
The observation task changes
During the week beginning 23 May, NOAA’s National Geodetic Survey deployed aerial-imagery support for the response. These later views documented the damage footprint; their acquisition belongs to the aftermath rather than to the active tornado.
Basis: NOAA National Weather Service [1] · NOAA National Weather Service, Central Region Headquarters [2] · NOAA National Geodetic Survey [3]
Selected observations & analyses
These entries preserve the source’s reported quantities or analyses. They are not a newly processed observational dataset.
| Evidence | Reported value or finding | Provenance |
|---|---|---|
| Maximum assessed intensity | EF5 | NWS Central Region service assessment, July 2011; a post-event rating derived from damage indicators, not a citywide anemometer reading. |
| Damage mapping | NOAA King Air aircraft imagery collected during the response | National Geodetic Survey deployment notice dated 2 June 2011, referring to the week of 23 May; aerial surface imagery used by responding agencies. |
The atmospheric mechanism
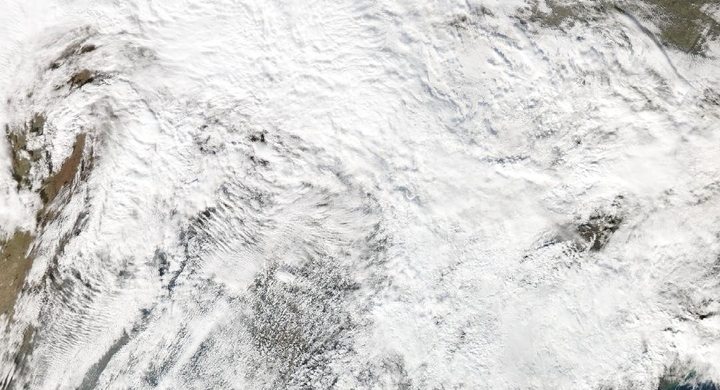
The parent thunderstorm and the tornado occupy very different scales. A supercell contains a persistent rotating updraft, but its broad rotation cannot simply be drawn downward as a tornado of equal width. Near-surface inflow, outflow and the stretching of rotation determine much smaller and rapidly changing structures. That scale difference explains why a cloud image can show a formidable storm without resolving the circulation responsible for a particular damaged street.
Afterward, survey teams work in the opposite direction: they use effects on buildings and vegetation to infer the winds that acted there. Construction, anchoring and exposure matter because different structures can fail under different loads. Aerial photographs help connect the spatial pattern, while ground inspection helps explain individual failures. Combining them strengthens the interpretation; neither replaces the other. The remote-sensing lab illustrates why a sensor’s sampling geometry must be understood before assigning a surface meaning to its display.
Basis: NOAA National Weather Service [1] · NOAA National Weather Service, Central Region Headquarters [2] · NOAA National Geodetic Survey [3]
What the evidence does not establish
The timeline includes the start of documented response imagery, not an extra day of tornado activity. This educational account does not assess individual protective decisions or claim that all damage within the city was EF5. A satellite image of the parent storm, a radar signature and a later photograph of damage each have different times, resolutions and inferential limits.
Ask whether each image shows the active storm or its aftermath, and distinguish the highest surveyed intensity from the conditions across the whole city.
Sources & provenance
- Remembering Joplin Tornado NOAA National Weather Service · 2012-05-22Reference only; original paraphrase; no source media reproduced.
- NWS Central Region Service Assessment: Joplin, Missouri, Tornado — May 22, 2011 NOAA National Weather Service, Central Region Headquarters · 2011-07Reference only; original paraphrase; no source media reproduced.
- NOAA Collects Disaster Response Imagery in Tornado-stricken Joplin NOAA National Geodetic Survey · 2011-06-02Reference only; original paraphrase; no source media reproduced.
Explanations and diagrams are original educational interpretations. Source institutions have not endorsed or reviewed this publication. How we distinguish evidence from models.