Follow the sequence
A line crosses central Iowa
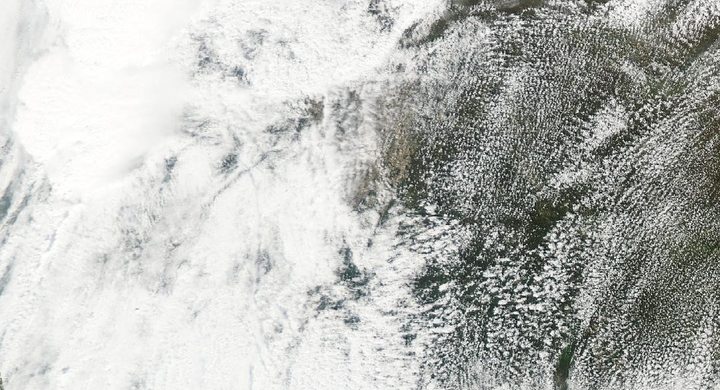
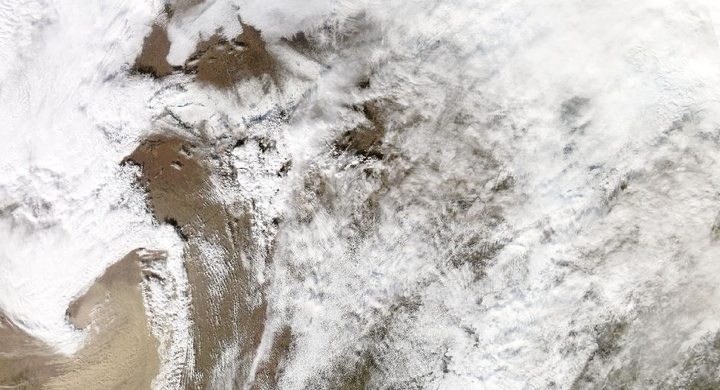
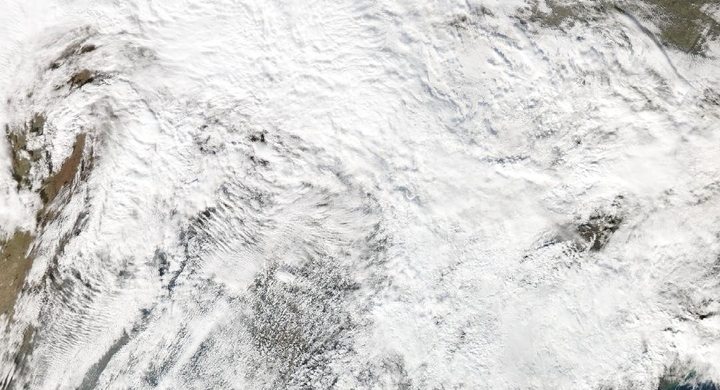
The NWS Des Moines radar sequence follows the morning and midday progression of the convective system. Surface instruments sampled brief portions of a much broader and evolving wind field as the line moved east.
Extreme winds affect eastern Iowa and Illinois
NWS Quad Cities documents extensive straight-line damage around Cedar Rapids and surrounding counties. The continuing system also produced tornadoes farther along its route, including tracks documented by NWS Chicago.
The footprint remains visible from space
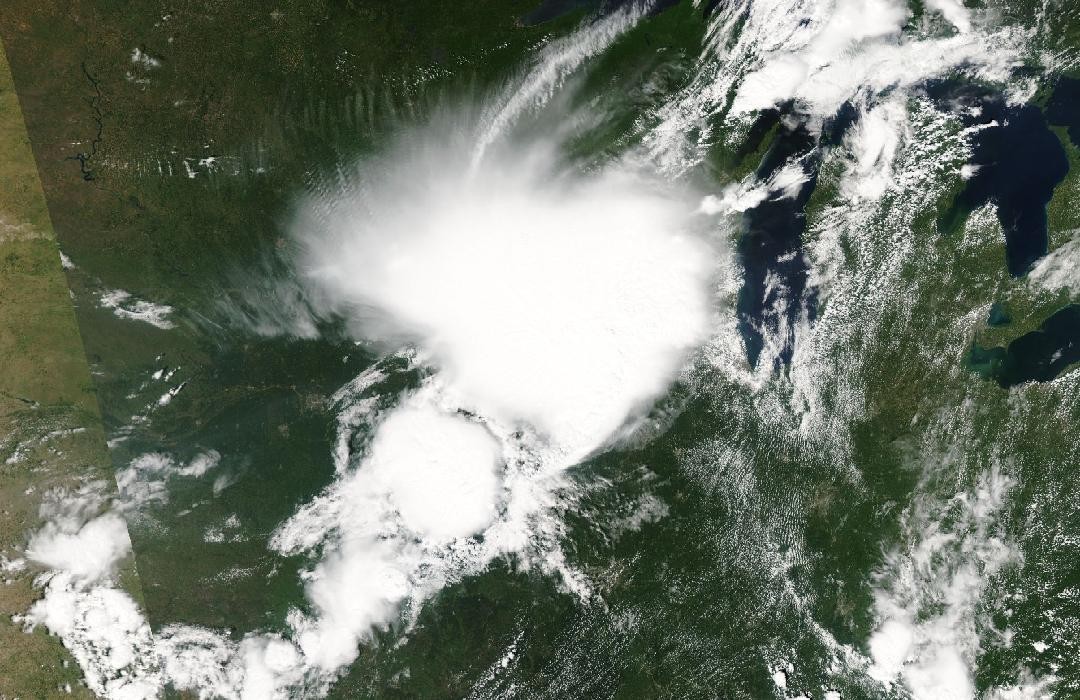
The NWS Des Moines account compares Terra MODIS imagery from 28 July and 11 August to show changes across cropland after the derecho. This later land-surface pattern is aftermath evidence, not an image of the peak wind.
Basis: NOAA National Weather Service, Des Moines [1] · NOAA National Weather Service, Quad Cities [2] · NOAA National Weather Service, Chicago [3]
Selected observations & analyses
These entries preserve the source’s reported quantities or analyses. They are not a newly processed observational dataset.
| Evidence | Reported value or finding | Provenance |
|---|---|---|
| Instrumented gust | 104 mph / about 46.7 m/s near Zearing | Iowa Atmospheric Observatory 10-m tower measurement reproduced by NWS Des Moines; a local instantaneous maximum, not a regional mean wind. |
| Damage-based maximum | Around 140 mph / 225 km/h in southwest Cedar Rapids | NWS Quad Cities assessment; inferred from damage and distinct from a directly measured instrument gust. |
| Post-storm satellite comparison | 28 July versus 11 August 2020 | Terra MODIS comparison in the NWS Des Moines event report; the two scenes bracket the 10 August event. |
The atmospheric mechanism
Rain-cooled air descending through thunderstorms spreads outward near the ground. In an organized line, that outflow can help lift warm air along its leading edge, sustaining new updrafts as the system advances. Strong flow within and behind the line can contribute to a bowing radar pattern and widespread damaging gusts. This is a different geometry from a narrow tornado, even when the resulting structural damage is severe.
The three observation types constrain different parts of the story. A well-exposed station gives a timed sample at one point. A survey fills spatial gaps but must infer the wind from effects. A changed crop pattern can reveal the breadth of the affected landscape without giving an exact gust for every field. Agreement among them supports a coherent regional reconstruction, while their differences keep the reconstruction from claiming impossible precision.
Basis: NOAA National Weather Service, Des Moines [1] · NOAA National Weather Service, Quad Cities [2] · NOAA National Weather Service, Chicago [3]
What the evidence does not establish
A derecho can contain embedded tornadoes, so the presence of a few tornado tracks does not turn the entire wind swath into one vortex. A satellite difference may also contain changes unrelated to wind, including crop development and illumination. The geostrophic wind lab does not simulate thunderstorm outflow; the linked remote-sensing lab instead develops the habit of checking what a sensor actually samples.
Label every wind value as measured or estimated, and read the later crop-damage image as a footprint rather than a map of identical gusts.
Sources & provenance
- August 10, 2020 Derecho NOAA National Weather Service, Des Moines · Publication date not statedReference only; original paraphrase; no source media reproduced.
- Midwest Derecho — August 10, 2020 NOAA National Weather Service, Quad Cities · 2020-08-20, page updateReference only; original paraphrase; no source media reproduced.
- August 10, 2020: Corn Belt Derecho NOAA National Weather Service, Chicago · Publication date not statedReference only; original paraphrase; no source media reproduced.
Explanations and diagrams are original educational interpretations. Source institutions have not endorsed or reviewed this publication. How we distinguish evidence from models.