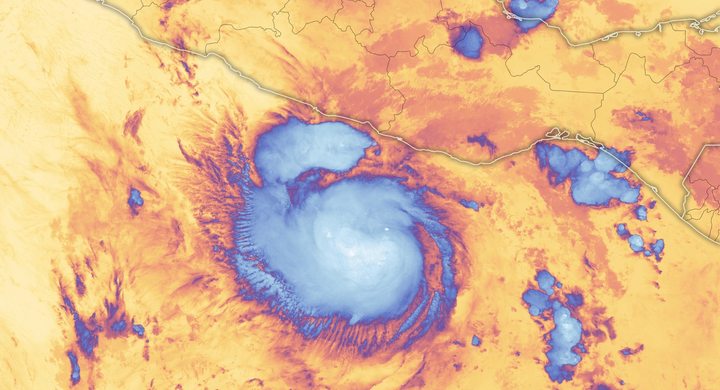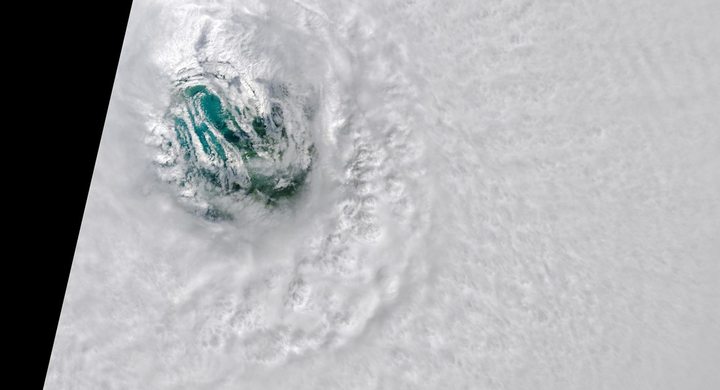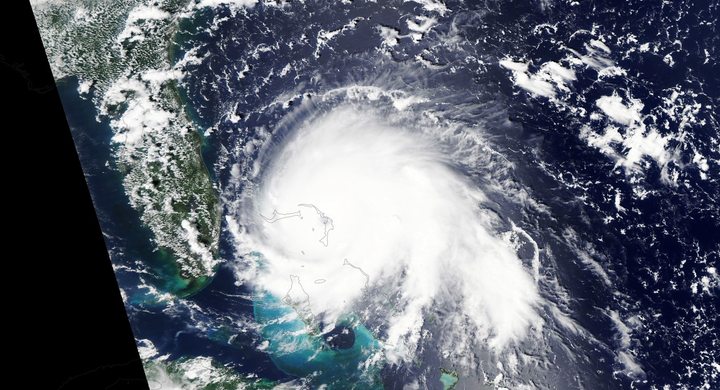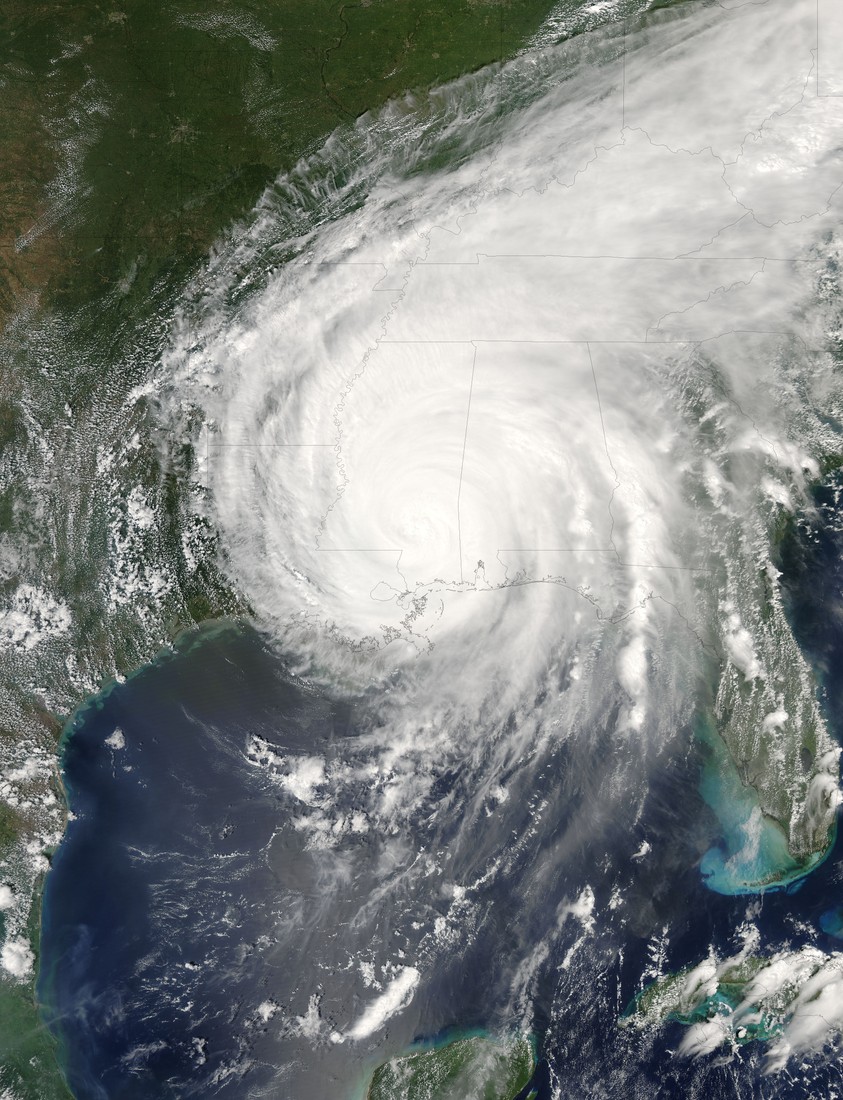
Follow the sequence
First landfall in Florida
NHC places the first United States landfall at about 22:30 UTC near the Miami-Dade–Broward county boundary, with an estimated maximum sustained wind of 70 knots.
A large hurricane over the Gulf
The post-event analysis gives a peak intensity of 150 knots at 18:00 UTC. Terra MODIS observed the broad cloud circulation earlier that afternoon, before the northern Gulf landfalls.
Northern Gulf landfalls
Katrina reached Buras, Louisiana, at 11:10 UTC with estimated 110-knot winds, then the Louisiana–Mississippi border at 14:45 UTC with 105-knot winds.
Floodwater remains
Terra MODIS acquired a view of flooding around New Orleans at 11:45 CDT. This later surface-water observation addresses the aftermath rather than the hurricane’s offshore peak.
Basis: NOAA National Hurricane Center [1] · NASA Earth Observatory [2] · NASA Earth Observatory [3]
Selected observations & analyses
These entries preserve the source’s reported quantities or analyses. They are not a newly processed observational dataset.
| Evidence | Reported value or finding | Provenance |
|---|---|---|
| Peak intensity estimate | 150 kt; 902 hPa minimum pressure | NHC best-track analysis for 18:00 UTC on 28 August 2005; wind is an estimated maximum sustained surface value. |
| Post-landfall satellite evidence | Terra MODIS, 30 August 2005 | NASA’s Flooding in New Orleans comparison identifies expanded surface water relative to 27 August; visible extent is not a depth measurement. |
The atmospheric mechanism
The distinction to keep is between a local maximum and the area over which force acts. Hurricane category describes the strongest sustained wind. Water responds to the wider wind field, the duration of onshore flow, coastal shape and water depth. A broad storm can continue pushing water toward a shallow coast while its highest winds decline. Coastal flooding therefore cannot be inferred by reading a category change as an equivalent change in every hazard.
NHC’s reconstruction describes internal eyewall changes and an expanding wind field. An outer ring of thunderstorms can reorganize a cyclone’s strongest winds; the small inner maximum and the total circulation need not change together. For an observer comparing satellite frames, a changing eye is evidence of structure, not a direct measurement of sea level. To connect the cloud system to flooding, add coastal water observations and the timing of landfall, then distinguish those from water that subsequently entered or remained within protected lowlands.
Basis: NOAA National Hurricane Center [1] · NASA Earth Observatory [2] · NASA Earth Observatory [3]
What the evidence does not establish
The reported landfall winds are best-track estimates, not measurements at every community. Satellite flood mapping is restricted by clouds, resolution and surface appearance. This meteorological case does not allocate the consequences of individual levee failures or reconstruct the depth of flooding street by street. Those questions require engineering and hydrological records as well as weather evidence.
Read the wind category together with storm size, coastal geometry and the timing of water observations; a lower category alone cannot establish a lower flood threat.
Sources & provenance
- Tropical Cyclone Report: Hurricane Katrina NOAA National Hurricane Center · 2023-01-04, updated reportReference only; original paraphrase; no source media reproduced.
- Hurricane Katrina NASA Earth Observatory · 2005-08-28Reference only; original paraphrase; no source media reproduced.
- Flooding in New Orleans NASA Earth Observatory · 2005-08-31Reference only; original paraphrase; no source media reproduced.
Explanations and diagrams are original educational interpretations. Source institutions have not endorsed or reviewed this publication. How we distinguish evidence from models.