Follow the sequence
A circulation reforms
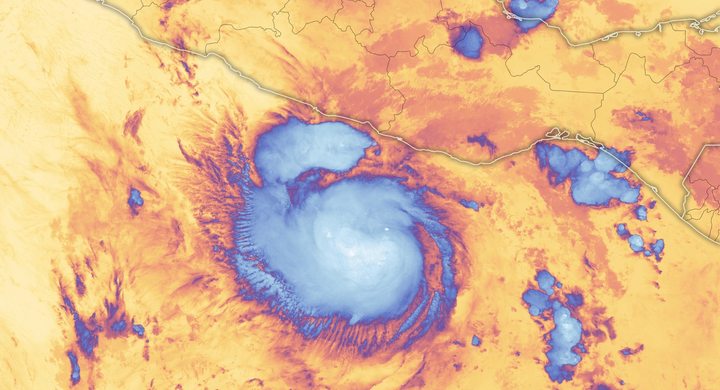
The National Hurricane Center reconstruction places a regenerated tropical depression in the Bay of Campeche at 12:00 UTC. This is a post-event analysis, not the first moment anyone saw cloud.
The cloud system approaches
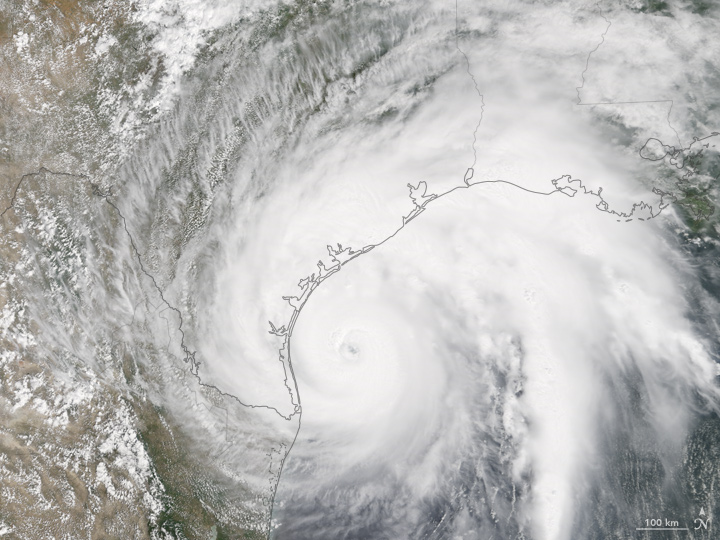
Terra MODIS observed the hurricane at 17:25 UTC. The eye and curved cloud bands are visible; this image precedes landfall and is not a map of accumulated rainfall.
Landfall, then a stall
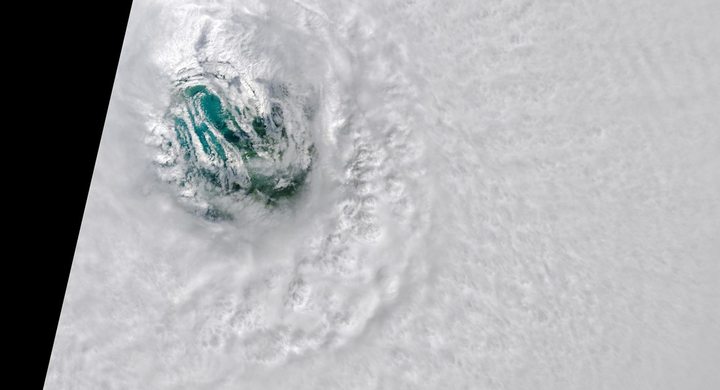
First Texas landfall occurred at 03:00 UTC, equivalent to 22:00 CDT on 25 August. Harvey weakened over land and its northwestward progress stopped later on 26 August.
Another landfall
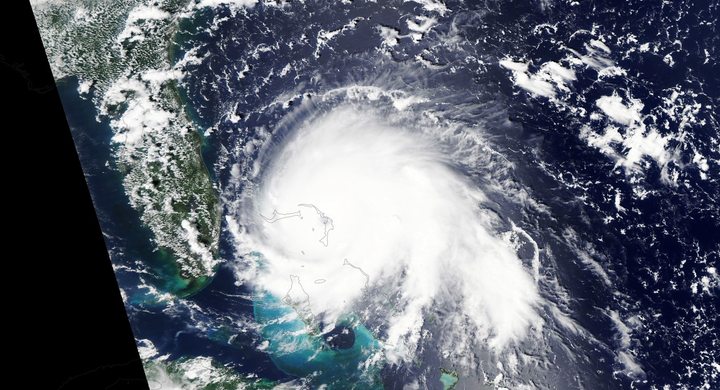
Harvey came ashore near Cameron, Louisiana, at 08:00 UTC as a tropical storm. Rainfall impacts extended far beyond the small area of strongest winds.
Basis: Eric S. Blake and David A. Zelinsky, NOAA National Hurricane Center [1] · NOAA National Weather Service, Lake Charles [2] · NASA Earth Observatory [3]
Selected observations & analyses
These entries preserve the source’s reported quantities or analyses. They are not a newly processed observational dataset.
| Evidence | Reported value or finding | Provenance |
|---|---|---|
| Texas landfall wind | 115 kt, maximum sustained | NHC best-track analysis; 03:00 UTC, 26 August 2017; a storm-intensity estimate, not a measurement everywhere. |
| Largest reported event rainfall | 60.58 in / 1,538.7 mm near Nederland | NWS Lake Charles event summary; multi-day storm total, not an hourly rate. |
| Satellite observation | 25 August 2017, 17:25 UTC | NASA Terra / MODIS natural-color image; visible cloud tops and land/ocean context. |
The atmospheric mechanism
The NHC attributes rapid strengthening over the Gulf to a favorable environment including warm water, abundant mid-level moisture and weak vertical wind shear. But the mechanism that made rainfall last was different: the winds steering the whole cyclone became weak between larger high-pressure areas. A cyclone can contain fast rotating winds while its center hardly moves.
For interpretation, separate rain rate from residence time. Imagine two otherwise identical rainbands: one crosses a town once, while another repeatedly returns. The second can deliver a much larger total without a larger instantaneous rate. Harvey also interacted with a nearby frontal boundary. The conceptual cross-section on this site illustrates moisture convergence and rising air; its heights, arrows and timing are not recovered measurements of Harvey.
Basis: Eric S. Blake and David A. Zelinsky, NOAA National Hurricane Center [1] · NOAA National Weather Service, Lake Charles [2] · NASA Earth Observatory [3]
What the evidence does not establish
The satellite frame establishes cloud structure at one acquisition time. It cannot determine a gauge total, street-level flood depth, or the full temperature profile. The rainfall figure is a reported point maximum; neither it nor the hurricane category describes every location. This case explains meteorological ingredients, not the contribution of each factor to individual flood losses.
Compare the date of the cloud image, the landfall analysis and the rainfall accumulation window before connecting them. Different instruments answer different questions about the same event.
Sources & provenance
- Tropical Cyclone Report: Hurricane Harvey (AL092017) Eric S. Blake and David A. Zelinsky, NOAA National Hurricane Center · 2018-05-09, updated reportReference only; original paraphrase; no source media reproduced.
- Hurricane Harvey 2017 NOAA National Weather Service, Lake Charles · Publication date not statedReference only; original paraphrase; no source media reproduced.
- Hurricane Harvey Approaches Texas NASA Earth Observatory · 2017-08-26Reference only; original paraphrase; no source media reproduced.
Explanations and diagrams are original educational interpretations. Source institutions have not endorsed or reviewed this publication. How we distinguish evidence from models.