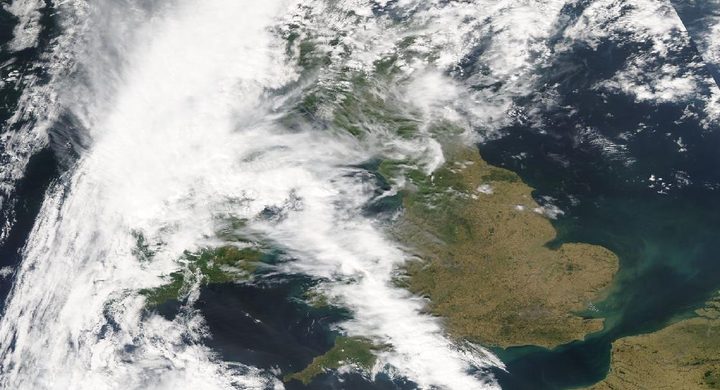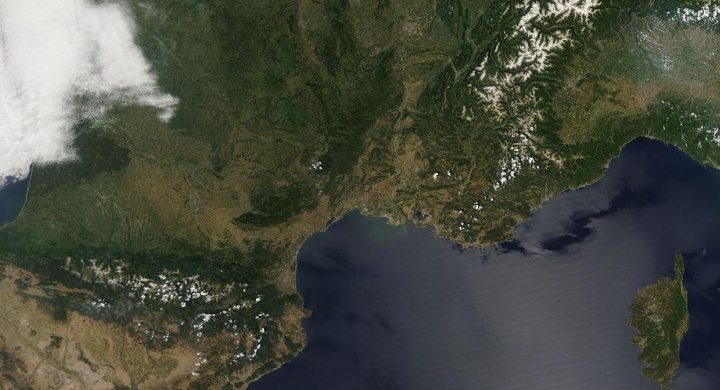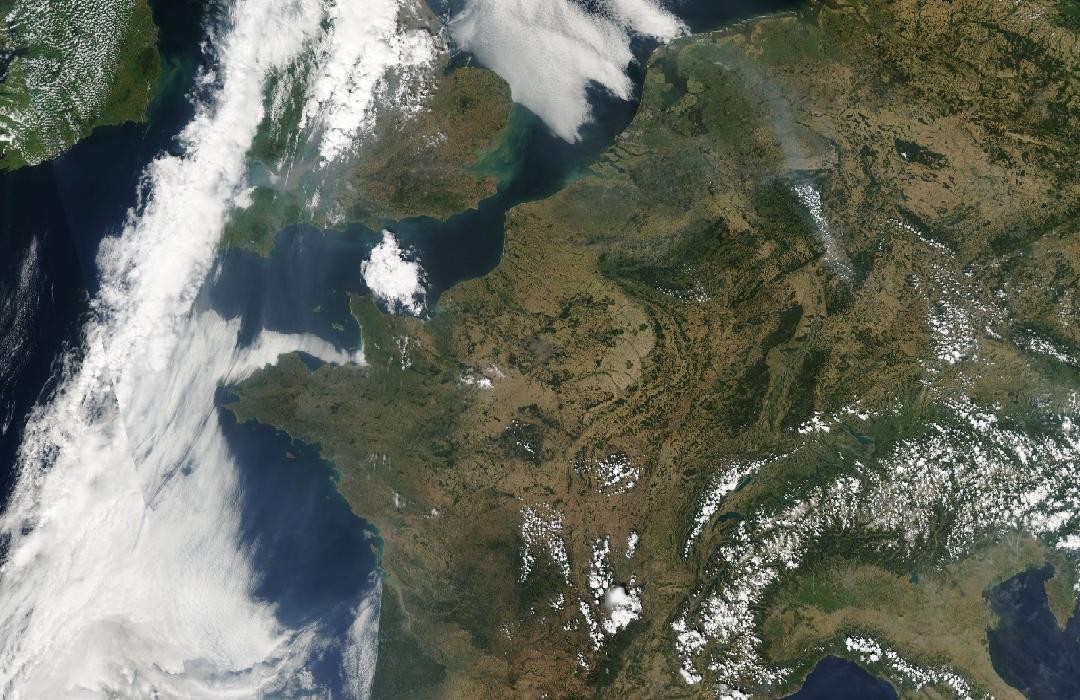
Follow the sequence
France’s national mean reaches an extreme
Météo-France’s retrospective comparison gives a national daily mean of 29.4°C on 5 August 2003. This statistic combines temperatures across the country rather than selecting its single hottest observation.
A UK station sets the then national record
Brogdale in Kent measured 38.5°C on 10 August, according to the Met Office. It was the UK record at the time, not a claim about the current record.
A French station maximum sets another benchmark
Météo-France identifies 44.1°C measured in the Gard on 12 August as the French national maximum later surpassed in 2019. The selected dates are milestones within a broader summer heat episode.
Basis: Met Office [1] · Météo-France [2]
Selected observations & analyses
These entries preserve the source’s reported quantities or analyses. They are not a newly processed observational dataset.
| Evidence | Reported value or finding | Provenance |
|---|---|---|
| National daily mean | 29.4°C in France on 5 August | Météo-France’s 2019 retrospective uses 5 August 2003 as the comparison for its later national mean record. |
| UK station maximum | 38.5°C at Brogdale, Kent, on 10 August | Met Office heatwave-of-2003 account; a maximum air temperature at one observing location. |
| French station maximum | 44.1°C in the Gard on 12 August | Météo-France’s historical comparison of national maximum-temperature records. |
The atmospheric mechanism
Persistent high pressure reduced the frequency of rain-bearing systems and helped hot conditions continue. When soils are dry, less available surface energy can be used for evaporation, leaving more to warm the ground and the air above it. That feedback is physically different from importing warmer air, although both can contribute during a long heatwave. An individual station maximum cannot separate their contributions.
The different record dates also expose a scale problem. A national average is largest when warmth is widespread, even if no single location reaches its absolute highest value. A station maximum may instead reflect a more local combination of air mass, sunshine, mixing and exposure. Comparing them is useful only when the statistic and spatial coverage remain attached to each number.
Basis: Met Office [1] · Météo-France [2]
What the evidence does not establish
The event window here selects three August milestones; it is not a newly calculated beginning and end for the entire European heatwave. No mortality totals or modern return periods are inferred from the temperature observations. A dry summer, a hot week and an exceptional afternoon have different durations, and a later record does not alter what was measured in 2003.
Before comparing heat records, name the statistic: an individual maximum, a daily national mean and a multi-day regional average answer different questions.
Sources & provenance
- The heatwave of 2003 Met Office · Publication date not stated; retrospective event accountReference only; original paraphrase; no source media reproduced.
- Été 2019: deux canicules exceptionnelles — historical comparisons with 2003 Météo-France · 2020-03-05Reference only; original paraphrase; no source media reproduced.
Explanations and diagrams are original educational interpretations. Source institutions have not endorsed or reviewed this publication. How we distinguish evidence from models.