Follow the sequence
The blocking pattern is established
The WMO regional climate-centre report identifies a fully developed, extensive Siberian blocking high around 25 January. Its southern flank helped direct cold air toward progressively more of Europe.
A satellite sampling period closes
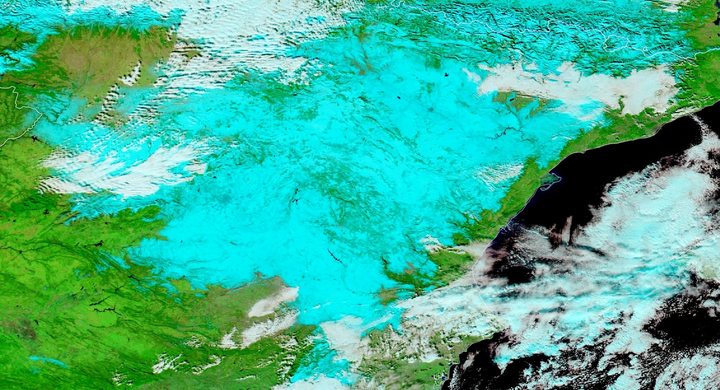
NASA’s Terra MODIS analysis covers 25 January–1 February. It shows widespread negative land-surface temperature anomalies relative to the same dates in 2001–11, providing a spatial view of the developing cold spell.
The circulation’s grip weakens
The regional report describes the cold wave weakening in Europe around mid-February. This date marks that approximate transition in the selected account, not a simultaneous thaw at every observing station.
Basis: WMO Regional Climate Centres / DWD and JMA [1] · NASA Earth Observatory [2]
Selected observations & analyses
These entries preserve the source’s reported quantities or analyses. They are not a newly processed observational dataset.
| Evidence | Reported value or finding | Provenance |
|---|---|---|
| Satellite spatial pattern | Negative land-surface temperature anomalies across much of Europe, especially near the Black Sea and northwestern Russia | NASA Earth Observatory’s MODIS comparison for 25 January–1 February 2012; a surface-radiance product, not standard-height air temperature. |
| Circulation diagnosis | An extensive blocking high obstructed the eastward passage of mild maritime air and Atlantic storms | WMO regional climate centres at DWD and JMA, retrospective circulation analysis. |
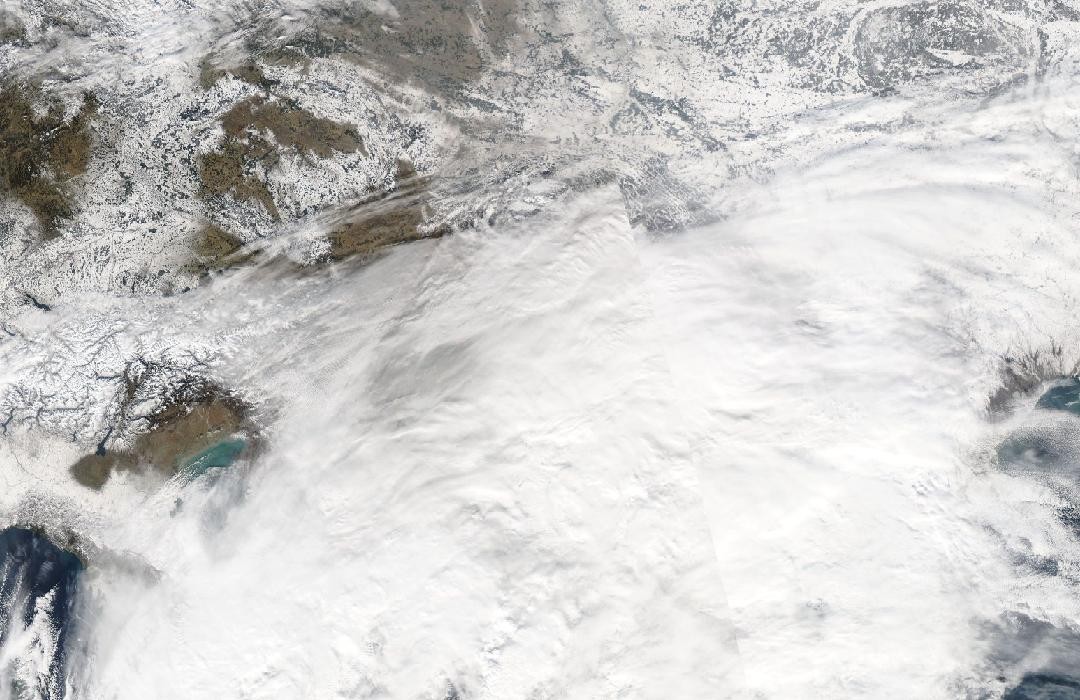
| Contrasting southern weather | Mediterranean low-pressure systems accompanied unusually snowy conditions in southeastern Europe and Turkey | DWD/JMA regional report; a qualitative regional finding, not a uniform snow-depth estimate. |
The atmospheric mechanism
Blocking describes a circulation configuration that persists and redirects the usual movement of weather systems. It does not mean that the air stops moving. Air can travel strongly around the block while successive locations receive a similar source air mass. Europe’s change from an earlier mild period illustrates why a monthly average can hide a sharp transition inside the month.
Cold air alone does not guarantee snowfall. Moisture and ascent are still necessary. Mediterranean lows provided those ingredients in parts of the southern cold-air footprint, while other cold areas could be relatively dry. A temperature-anomaly map cannot tell these situations apart by itself. Pairing it with precipitation records and pressure analyses separates the extent of cooling from the location of snow production.
Basis: WMO Regional Climate Centres / DWD and JMA [1] · NASA Earth Observatory [2]
What the evidence does not establish
The satellite comparison uses land-surface temperature and a short reference period, whereas a station climate summary usually uses screened air temperatures and a different baseline. Cloud also affects infrared sampling. Neither the anomaly colours nor a hemispheric circulation index determines the minimum temperature at a particular house. The mid-February endpoint is an approximate regional evolution, explicitly retained as such.
Identify the air’s source and the circulation that keeps replacing it; then assess moisture and ascent separately before connecting cold weather with snowfall.
Sources & provenance
- Cold spell in Europe and Asia in late winter 2011/2012 WMO Regional Climate Centres / DWD and JMA · 2012-03-15Reference only; original paraphrase; no source media reproduced.
- Cold Snap Across Europe NASA Earth Observatory · 2012-02-10Reference only; original paraphrase; no source media reproduced.
Explanations and diagrams are original educational interpretations. Source institutions have not endorsed or reviewed this publication. How we distinguish evidence from models.