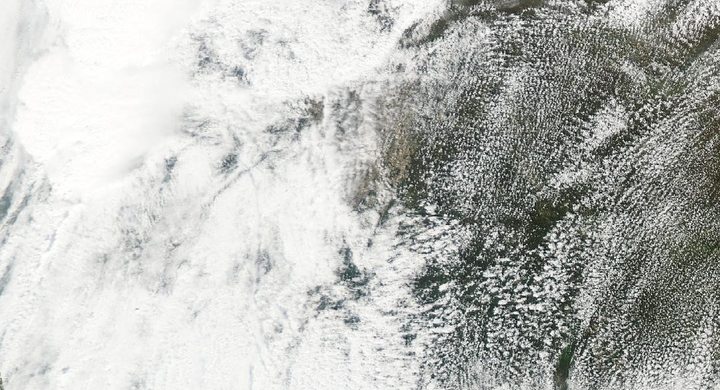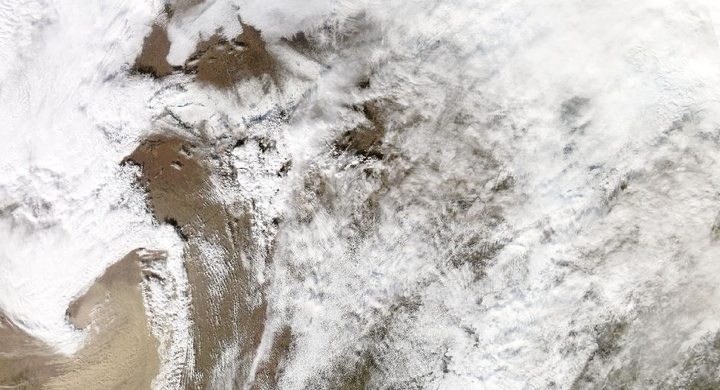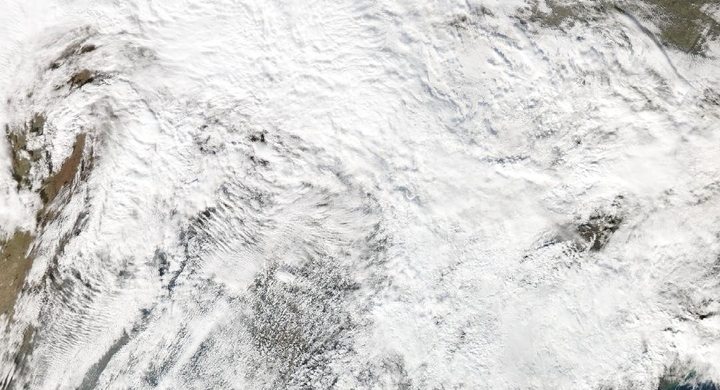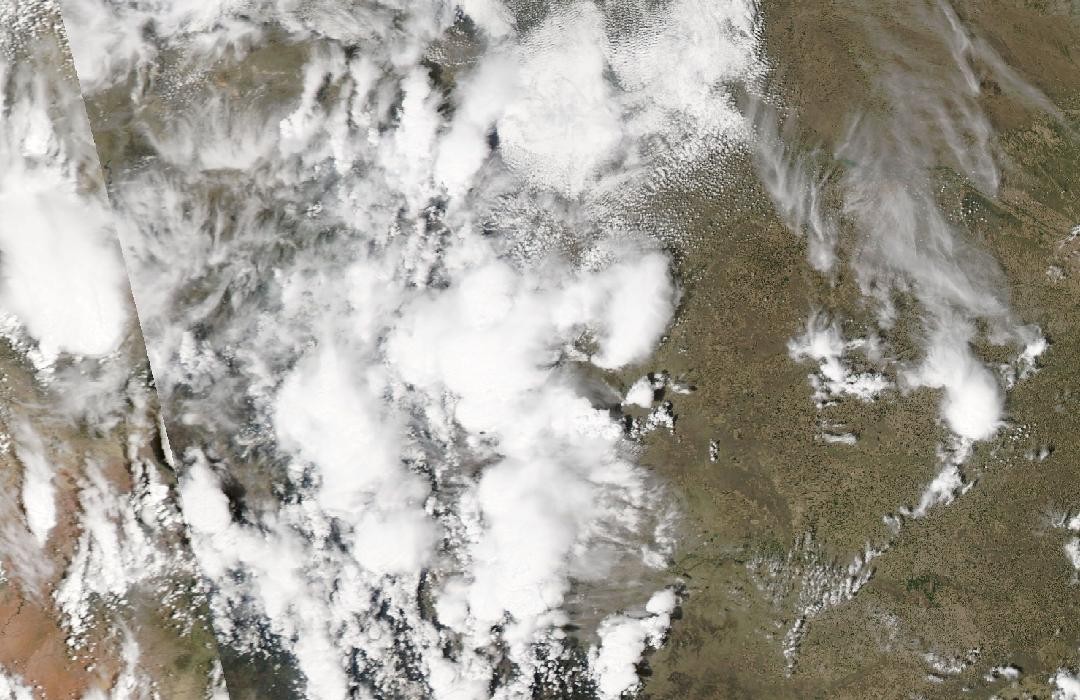
Follow the sequence
A supercell grows over the foothills
The NWS Boulder retrospective describes early-afternoon development in the higher foothills west of Denver. The storm then moved through western and northern suburbs rather than affecting every part of the metropolitan area equally.
Cloud growth and hail are observed differently
GOES-16 collected visible images at 30-second intervals, revealing changing texture and overshooting cloud tops. Meanwhile, NWS Boulder assembled surface hail reports and a hail-swath estimate from the Front Range radar.
Ice remains after the storm
NOAA’s following-day satellite-video description reports hail still covering parts of the Denver area more than twelve hours later. That residual ice belongs to the aftermath and does not indicate twelve hours of continuous hailfall.
Basis: NOAA National Weather Service, Boulder [1] · NOAA National Weather Service, Boulder [2] · NOAA Satellites / NOAA NESDIS, with CIRA imagery [3]
Selected observations & analyses
These entries preserve the source’s reported quantities or analyses. They are not a newly processed observational dataset.
| Evidence | Reported value or finding | Provenance |
|---|---|---|
| Surface hail reports | Hail up to baseball size around affected western suburbs | NWS Boulder severe-weather report; an observer size category for reported locations, not a laboratory diameter assigned throughout the radar swath. |
| Satellite sampling interval | 30 seconds in the displayed GOES-16 visible sequence | NOAA Satellites description, published 9 May; this is image acquisition frequency, not the duration of the storm or the length of time a hailstone stayed aloft. |
| Satellite channel | Advanced Baseline Imager Band 2, red-visible imagery | NOAA Satellites explanation; reflected sunlight shows cloud-top texture and requires daylight, unlike an infrared brightness-temperature measurement. |
The atmospheric mechanism
An overshooting top marks a vigorous updraft that temporarily rises above the surrounding anvil. Rapid images can reveal its growth and collapse, offering clues about changing storm strength. But the visible top is far above the hail’s eventual landing point, and particles travel through different parts of the updraft, precipitation region and melting layer before reaching the ground.
Hail size at the surface depends on growth conditions, residence time and melting, not simply on how bright a cloud looks. Radar adds information from within the storm, but its hail-size products are estimates derived from sampled volumes and assumptions. A ground report supplies a more direct local constraint. The most informative reading compares their times and locations, allowing each observation to contribute without assigning it a capability it does not possess.
Basis: NOAA National Weather Service, Boulder [1] · NOAA National Weather Service, Boulder [2] · NOAA Satellites / NOAA NESDIS, with CIRA imagery [3]
What the evidence does not establish
GOES-16 data in the cited May 2017 demonstration were still experimental and undergoing testing. The surviving hail on 9 May does not establish the maximum original diameter, and a white ground covering can be hail rather than snow. The remote-sensing lab uses synthetic radar and infrared examples; it does not reproduce this visible-band sequence or calculate hail size.
Read the sensor, channel and sampling interval before interpreting dramatic cloud detail, then compare it with independently located surface reports.
Sources & provenance
- Severe Weather Report for May 8, 2017 NOAA National Weather Service, Boulder · Publication date not statedReference only; original paraphrase; no source media reproduced.
- Top Colorado Weather Events for the Decade 2010–2019: May 8, 2017 hailstorm NOAA National Weather Service, Boulder · Retrospective covering 2010–2019Reference only; original paraphrase; no source media reproduced.
- Severe Storms in Colorado (May 8) NOAA Satellites / NOAA NESDIS, with CIRA imagery · 2017-05-09Reference only; original paraphrase; no source media reproduced.
Explanations and diagrams are original educational interpretations. Source institutions have not endorsed or reviewed this publication. How we distinguish evidence from models.