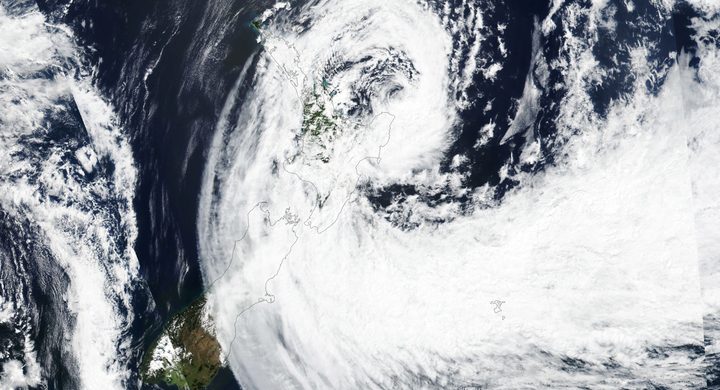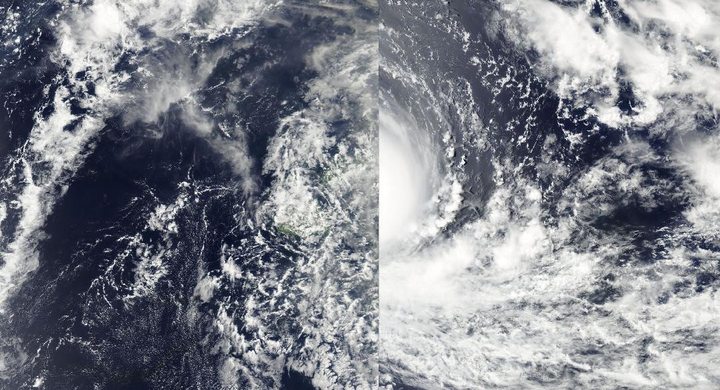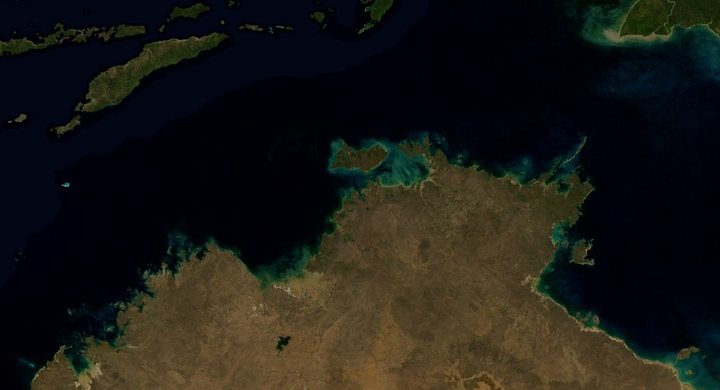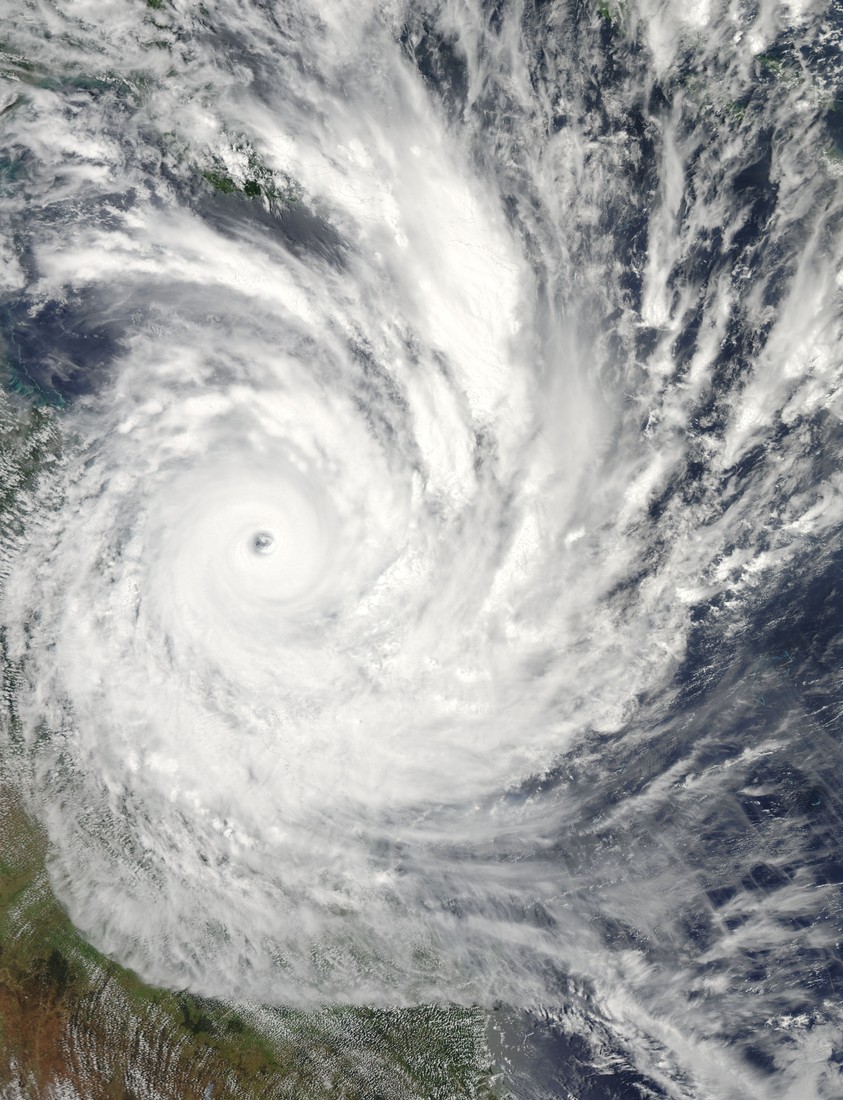
Follow the sequence
Named in the South Pacific
The Bureau of Meteorology account records Yasi being named by the Fiji Meteorological Service late on 30 January as the developing circulation moved westward north of Vanuatu.
Strengthening toward Queensland
The Bureau describes an upgrade to Australian Category 4 during the evening, followed by a more west-southwestward and accelerating approach toward the tropical Queensland coast.
Category 5 approach
Yasi was upgraded to Australian Category 5 early on 2 February in the Bureau chronology and maintained that intensity as it approached the coast.
Landfall and inland weakening
Landfall occurred near Mission Beach between midnight and 01:00 Queensland local time. Yasi retained a damaging core inland before weakening to a tropical low near Mount Isa late that evening.
Basis: Australian Bureau of Meteorology [1] · Australian Bureau of Meteorology [2]
Selected observations & analyses
These entries preserve the source’s reported quantities or analyses. They are not a newly processed observational dataset.
| Evidence | Reported value or finding | Provenance |
|---|---|---|
| Tully pressure record | 929 hPa minimum | Barograph at Tully Sugar Mill as the eye passed, reported by the Bureau of Meteorology; a pressure measurement, not a direct wind measurement. |
| Estimated maximum gust | About 285 km/h | Bureau event summary estimate supported by pressure evidence; the summary explicitly states that verified maximum near-center gust observations were unavailable. |
The atmospheric mechanism
Pressure differences accelerate air toward lower pressure, while rotation and friction shape the resulting circulation. A very low central pressure is useful evidence of an intense cyclone, but the conversion from pressure to wind depends on the surrounding pressure field, storm size and structure. Yasi is a practical example of why an estimate inferred from a barograph should retain the word estimated. The instrument observed pressure; it did not somehow measure the wind at every point around the eye.
Landfall is also a geometrical moment rather than an instantaneous shutdown. A broad circulation can still reach warm sea surfaces while its center has crossed land. Stored moisture, strong existing winds and the storm’s size allow damaging weather to continue inland even as the system weakens. For a sequence of local observations, the eye passage, lowest pressure, peak gust and heaviest rain may occur at different times. Combining them into one generic landfall value loses the structure that explains those differences.
Basis: Australian Bureau of Meteorology [1] · Australian Bureau of Meteorology [2]
What the evidence does not establish
The times in the landfall description follow the Bureau’s Queensland local chronology, where early 3 February corresponds to 2 February in UTC. Australian cyclone categories should not be read as identical to the Saffir–Simpson scale. Some nearby pressure measurements on the historical page are explicitly unverified; they are not used as independent confirmation here.
Ask what the instrument actually measured, then distinguish that record from wind estimates, category assignments and the timing of the cyclone’s center crossing.
Sources & provenance
- Severe Tropical Cyclone Yasi Australian Bureau of Meteorology · Historical event account; publication date not statedReference only; original paraphrase; no source media reproduced.
- Queensland in February 2011 Australian Bureau of Meteorology · 2011-03, monthly climate summaryReference only; original paraphrase; no source media reproduced.
Explanations and diagrams are original educational interpretations. Source institutions have not endorsed or reviewed this publication. How we distinguish evidence from models.