Follow the sequence
The overnight wind episode begins
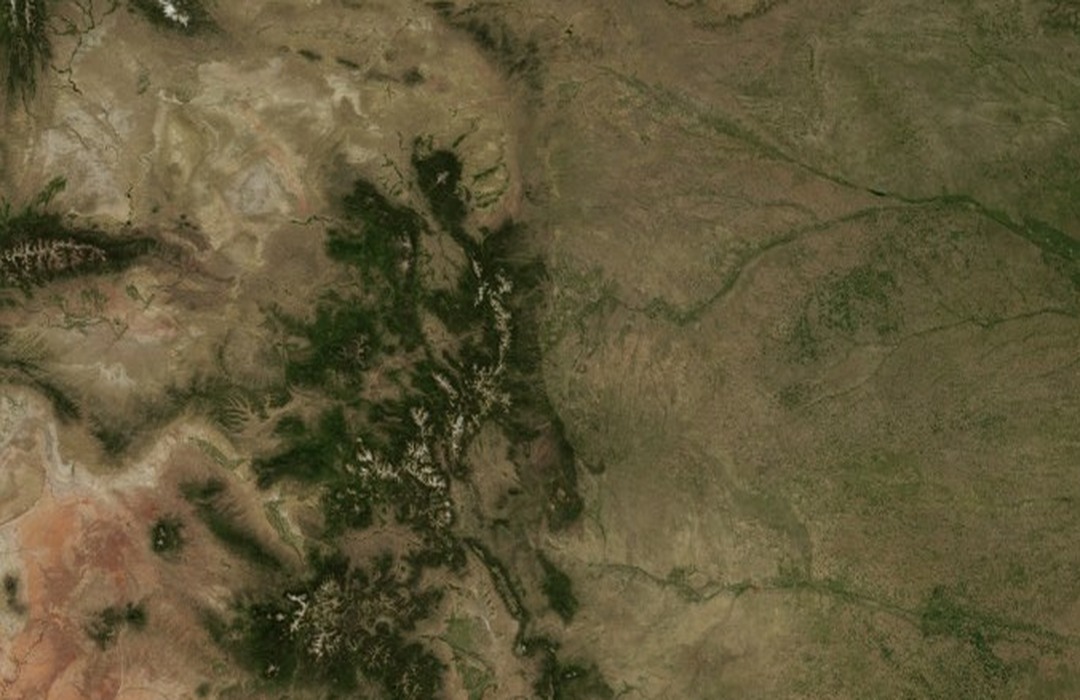
NOAA’s Boulder wind chronology dates this episode to the night of 16 January through the following afternoon. The overnight setting is consistent with the early-morning maximum recorded at NCAR.
NCAR records the peak
The NOAA chronology gives a 137 mph gust at NCAR at approximately 02:30 local time. The location and short-duration nature of the value are essential parts of the observation.
Repeated gusts mark a sustained episode
The same chronology records twenty gusts above 120 mph and continues the event into the afternoon. These repeated peaks demonstrate an episode of severe gustiness without implying that 137 mph was continuously sustained.
Basis: NOAA Physical Sciences Laboratory [1] · Jonathan Vigh / UCAR-hosted meteorology teaching review [2]
Selected observations & analyses
These entries preserve the source’s reported quantities or analyses. They are not a newly processed observational dataset.
| Evidence | Reported value or finding | Provenance |
|---|---|---|
| Peak gust at NCAR | 137 mph at about 02:30 on 17 January | NOAA Physical Sciences Laboratory Boulder wind-event chronology; local site value, not a citywide sustained wind. |
| Repeated extreme gusts | Twenty gusts above 120 mph | NOAA chronology, with a UCAR teaching review reporting the concentration of these gusts within about 45 minutes. |
| Nearby reported maximum | 136 mph at Lyons | NOAA’s event listing; a separate place and exposure from the NCAR instrument. |
The atmospheric mechanism
Air crossing a mountain range can be displaced vertically and oscillate in a stable atmosphere. Under favourable profiles of wind and stability, the wave response can produce strong descent and accelerated flow on the lee side. The resulting windstorm is not simply ordinary wind funnelled through one narrow canyon. Its footprint depends on the larger cross-mountain flow and the layered atmosphere above the ridge.
Descending air also warms as it is compressed, but temperature change is not a direct wind-speed gauge. Strong winds can occur in a narrow zone near the foothills while nearby sheltered or differently exposed locations experience much less. Gustiness adds another scale: brief turbulent peaks differ from the mean flow that an instrument would report over a longer averaging interval. The event is therefore best read as a set of located observations within a mountain-flow pattern.
Basis: NOAA Physical Sciences Laboratory [1] · Jonathan Vigh / UCAR-hosted meteorology teaching review [2]
What the evidence does not establish
The historical chronology is a compiled event list rather than a complete, uniformly sampled anemometer archive. It does not provide a wind profile sufficient to reconstruct the exact wave structure on this night. The mountain lab demonstrates lifting, cooling and drying; it does not calculate damaging downslope gusts or reproduce the NCAR measurements. Damage is not used here to manufacture additional wind-speed estimates.
Preserve instrument exposure and averaging time when reading mountain-wind reports; a dramatic peak belongs to a place and moment within a changing flow.
Sources & provenance
- Boulder Wind Events NOAA Physical Sciences Laboratory · Publication date not stated; retrospective event accountReference only; original paraphrase; no source media reproduced.
- Downslope Windstorms Jonathan Vigh / UCAR-hosted meteorology teaching review · 2005Reference only; original paraphrase; no source media reproduced.
Explanations and diagrams are original educational interpretations. Source institutions have not endorsed or reviewed this publication. How we distinguish evidence from models.