Follow the sequence
12:00 UTC · warming under way
The three-hourly station series reproduced in State of the Climate in 2020 reports 6.3°C at Esperanza.
15:00 UTC · the warm peak
The series reaches 18.3°C as relative humidity falls and winds shift from northeast to southwest. The report diagnoses foehn-related warming.
18:00–21:00 UTC · warmth persists
Reported temperatures remain 15.7°C at 18:00 UTC and 17.3°C at 21:00 UTC. This was more than a single isolated warm sample.
Basis: World Meteorological Organization [1] · American Meteorological Society; K. R. Clem and colleagues; NOAA Library repository [2]
Selected observations & analyses
These entries preserve the source’s reported quantities or analyses. They are not a newly processed observational dataset.
| Evidence | Reported value or finding | Provenance |
|---|---|---|
| Verified maximum | 18.3°C | Argentina SMN Esperanza observation, 6 February 2020; accepted by WMO on 1 July 2021 for the Antarctic continent. |
| Relative humidity at the warm peak | 27% | State of the Climate in 2020, Sidebar 6.1; station synoptic observations, not a regional humidity average. |
| Measurement height | 2 m air temperature | The report identifies a near-surface air measurement; it is not an ice-surface or satellite brightness temperature. |
The atmospheric mechanism
WMO’s investigation found that high pressure supported downslope warming. The broader analysis describes warm, moist air arriving from lower latitudes, with an additional local foehn effect east of the peninsula’s mountains. Descending air is compressed and warms. Processes on the windward slope and the height from which air descends can also affect its final temperature, so a mountain diagram should not be read as a complete heat budget for this station.
The useful comparison is between variables at the same place and time. A simultaneous temperature increase, humidity decrease and wind shift provides a more informative clue than temperature alone. Relative humidity can fall as air warms even without the loss of an equivalent fraction of its water vapor. In a teaching experiment, hold moisture fixed while warming the air, then compare that result with changing moisture as well.
Basis: World Meteorological Organization [1] · American Meteorological Society; K. R. Clem and colleagues; NOAA Library repository [2]
What the evidence does not establish
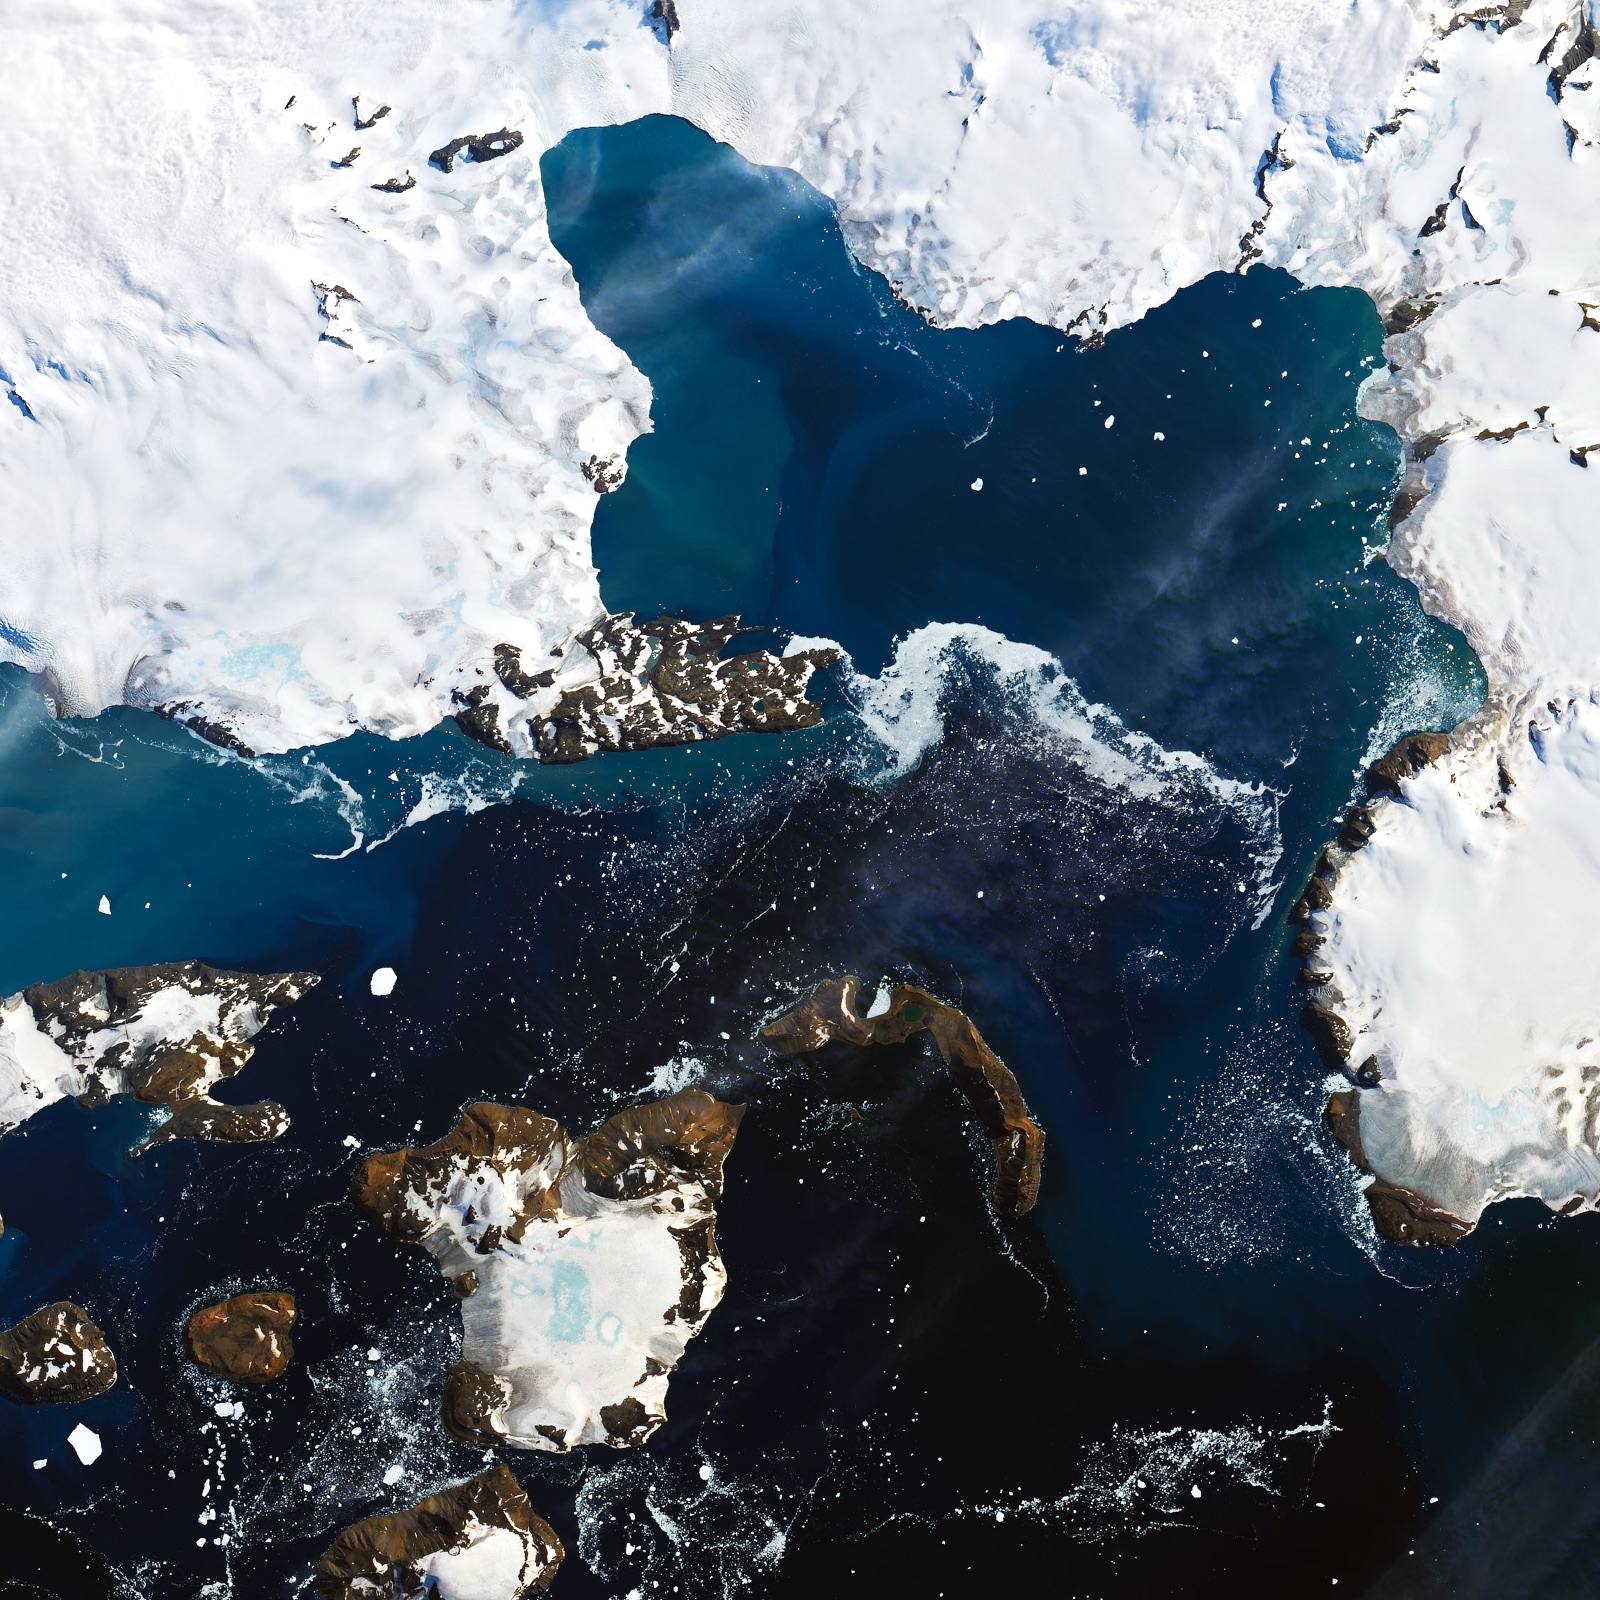
WMO accepted the Esperanza record after checking its instruments and metadata. It rejected a separate Seymour Island report because an improvised radiation shield biased that sensor. These are distinct stations and observations. The accepted category covers the Antarctic continent, not every island south of 60°S. Neither a local daily extreme nor this case alone measures a continent-wide climate trend.
Ask what was measured, where, when and with which instrument before comparing extremes. Then use the accompanying wind and humidity changes to test a physical explanation.
Sources & provenance
- WMO verifies one temperature record for Antarctic continent and rejects another World Meteorological Organization · 2021-07-01Reference only; original paraphrase; no source media reproduced.
- State of the Climate in 2020: Antarctica and the Southern Ocean, Sidebar 6.1 American Meteorological Society; K. R. Clem and colleagues; NOAA Library repository · 2021-08Reference only; original paraphrase; no source media reproduced.
Explanations and diagrams are original educational interpretations. Source institutions have not endorsed or reviewed this publication. How we distinguish evidence from models.